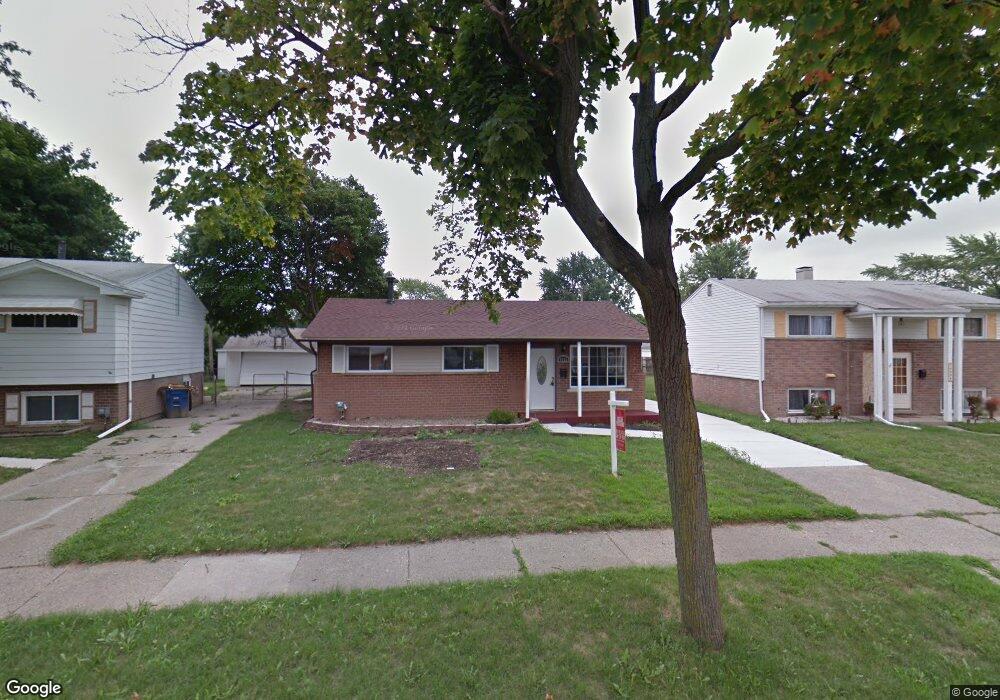
1643 Westchester St Westland, MI 48186
Estimated Value: $203,000 - $212,000
3
Beds
3
Baths
1,075
Sq Ft
$194/Sq Ft
Est. Value
About This Home
This home is located at 1643 Westchester St, Westland, MI 48186 and is currently estimated at $208,883, approximately $194 per square foot. 1643 Westchester St is a home located in Wayne County with nearby schools including Eugene B. Elliott Elementary School, Adams Middle School, and Benjamin Franklin Middle School.
Ownership History
Date
Name
Owned For
Owner Type
Purchase Details
Closed on
Aug 26, 2011
Sold by
Ab Rentals Llc
Bought by
Hollis Cathy M
Current Estimated Value
Purchase Details
Closed on
Mar 24, 2011
Sold by
Us Bank National Association
Bought by
Ab Rentals Llc
Purchase Details
Closed on
Jul 7, 2010
Sold by
Lawson Tori
Bought by
Us Bank National Association
Purchase Details
Closed on
Jan 12, 2007
Sold by
Lacalamita Michele Orlando
Bought by
Lawson Tori
Purchase Details
Closed on
Jun 1, 2006
Sold by
Lacalamita Michele
Bought by
Integrity Investors Llc
Purchase Details
Closed on
Apr 6, 2005
Sold by
Sawyer Theresa and Sawyer Lemuel K
Bought by
Federal Home Loan Mortgage Corporation
Purchase Details
Closed on
Jun 5, 2000
Sold by
Mcconell Christine R
Bought by
Sawyer Theresa R
Create a Home Valuation Report for This Property
The Home Valuation Report is an in-depth analysis detailing your home's value as well as a comparison with similar homes in the area
Home Values in the Area
Average Home Value in this Area
Purchase History
| Date | Buyer | Sale Price | Title Company |
|---|---|---|---|
| Hollis Cathy M | $79,900 | First Centennial Title Inc | |
| Ab Rentals Llc | $30,200 | Etitle Agency Inc | |
| Us Bank National Association | $46,750 | None Available | |
| Lawson Tori | $146,000 | Multiple | |
| Lacalamita Michele Orlando | -- | Multiple | |
| Integrity Investors Llc | -- | Title Source Inc | |
| Federal Home Loan Mortgage Corporation | $117,785 | -- | |
| Sawyer Theresa R | $115,000 | -- |
Source: Public Records
Tax History Compared to Growth
Tax History
| Year | Tax Paid | Tax Assessment Tax Assessment Total Assessment is a certain percentage of the fair market value that is determined by local assessors to be the total taxable value of land and additions on the property. | Land | Improvement |
|---|---|---|---|---|
| 2025 | $1,860 | $88,300 | $0 | $0 |
| 2024 | $1,860 | $84,200 | $0 | $0 |
| 2023 | $1,776 | $74,800 | $0 | $0 |
| 2022 | $2,087 | $67,300 | $0 | $0 |
| 2021 | $2,037 | $63,000 | $0 | $0 |
| 2020 | $2,013 | $55,100 | $0 | $0 |
| 2019 | $1,937 | $51,300 | $0 | $0 |
| 2018 | $1,461 | $45,000 | $0 | $0 |
| 2017 | $721 | $44,900 | $0 | $0 |
| 2016 | $1,885 | $44,400 | $0 | $0 |
| 2015 | $3,602 | $39,200 | $0 | $0 |
| 2013 | $3,497 | $36,470 | $0 | $0 |
| 2012 | $2,777 | $34,900 | $0 | $0 |
Source: Public Records
Map
Nearby Homes
- 30779 Middlebury St
- 30805 Parkwood St
- 1351 Mar Ann Dr
- 30270 Spring Arbor Dr
- 0 Henry Ruff Rd Unit 25008926
- 0 Henry Ruff Rd Unit 25008868
- 30129 Glenwood St
- 31820 Bay Ct
- 29956 Brooklane St
- 31842 Bay Ct
- 30030 Glenwood St
- 31784 Arenac Ct
- 29864 Brooklane St
- 30817 Birchwood Ave
- 1682 Beatrice St
- 30033 Avondale St
- 29855 Brooklane St
- 31203 Birchwood St
- 31612 Antrim Ct
- 31606 Fairchild St
- 1655 Westchester St
- 1631 Westchester St
- 1667 Westchester St
- 1570 Berkshire St
- 1619 Westchester St
- 1562 Berkshire St
- 1582 Berkshire St
- 1554 Berkshire St
- 1679 Westchester St Unit Bldg-Unit
- 1679 Westchester St
- 1596 Berkshire St
- 1607 Westchester St
- 1546 Berkshire St
- 1634 Berkshire St
- 1636 Westchester St
- 1658 Westchester St
- 1650 Berkshire St
- 0 Westchester St
- 1538 Berkshire St
- 1618 Westchester St