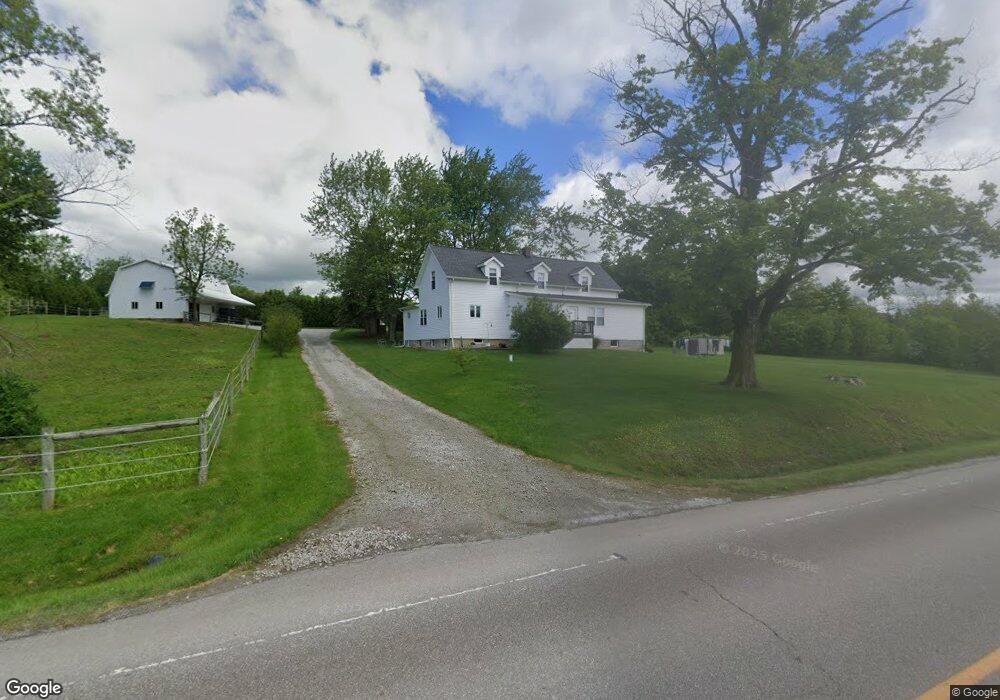
16432 Burton Windsor Rd Middlefield, OH 44062
Estimated Value: $226,000 - $271,000
4
Beds
1
Bath
2,323
Sq Ft
$110/Sq Ft
Est. Value
About This Home
This home is located at 16432 Burton Windsor Rd, Middlefield, OH 44062 and is currently estimated at $255,614, approximately $110 per square foot. 16432 Burton Windsor Rd is a home located in Geauga County with nearby schools including Jordak Elementary School, Cardinal Middle School, and Cardinal High School.
Ownership History
Date
Name
Owned For
Owner Type
Purchase Details
Closed on
May 15, 2015
Sold by
Miller Paul A and Miller Laura R
Bought by
Miller Robert E and Miller Mary Ellen
Current Estimated Value
Home Financials for this Owner
Home Financials are based on the most recent Mortgage that was taken out on this home.
Original Mortgage
$104,000
Outstanding Balance
$80,292
Interest Rate
3.74%
Mortgage Type
Adjustable Rate Mortgage/ARM
Estimated Equity
$175,322
Purchase Details
Closed on
Jun 26, 2013
Sold by
Burkholder Melvin D and Burkholder Erma E
Bought by
Miller Paul A and Miller Laura R
Home Financials for this Owner
Home Financials are based on the most recent Mortgage that was taken out on this home.
Original Mortgage
$122,046
Interest Rate
3.52%
Mortgage Type
New Conventional
Purchase Details
Closed on
Jan 10, 2001
Sold by
Burkholder Dan D and Burkholder Ida Y
Bought by
Burkholder Melvin D and Burkholder Erma E
Create a Home Valuation Report for This Property
The Home Valuation Report is an in-depth analysis detailing your home's value as well as a comparison with similar homes in the area
Home Values in the Area
Average Home Value in this Area
Purchase History
| Date | Buyer | Sale Price | Title Company |
|---|---|---|---|
| Miller Robert E | $130,000 | Attorney | |
| Miller Paul A | $120,000 | Attorney | |
| Burkholder Melvin D | -- | -- |
Source: Public Records
Mortgage History
| Date | Status | Borrower | Loan Amount |
|---|---|---|---|
| Open | Miller Robert E | $104,000 | |
| Previous Owner | Miller Paul A | $122,046 |
Source: Public Records
Tax History Compared to Growth
Tax History
| Year | Tax Paid | Tax Assessment Tax Assessment Total Assessment is a certain percentage of the fair market value that is determined by local assessors to be the total taxable value of land and additions on the property. | Land | Improvement |
|---|---|---|---|---|
| 2024 | $2,855 | $73,860 | $7,600 | $66,260 |
| 2023 | $2,855 | $73,860 | $7,600 | $66,260 |
| 2022 | $2,799 | $57,930 | $6,340 | $51,590 |
| 2021 | $2,618 | $57,930 | $6,340 | $51,590 |
| 2020 | $2,389 | $51,110 | $6,340 | $44,770 |
| 2019 | $2,071 | $40,920 | $6,340 | $34,580 |
| 2018 | $2,256 | $44,600 | $6,340 | $38,260 |
| 2017 | $2,071 | $40,920 | $6,340 | $34,580 |
| 2016 | $1,322 | $29,580 | $6,340 | $23,240 |
| 2015 | $1,253 | $29,580 | $6,340 | $23,240 |
| 2014 | $1,253 | $29,580 | $6,340 | $23,240 |
| 2013 | $1,313 | $29,580 | $6,340 | $23,240 |
Source: Public Records
Map
Nearby Homes
- 13105 Madison Rd
- 13689 Old State Rd
- 16270 Mayfield Rd
- 12342 Madison Rd
- 0 Old State Rd Unit 5157703
- 13137 Old State Rd
- 12175 Hunt Rd
- 16298 Weathervane Dr
- 14706 Steeplechase Dr
- 14753 Madison Rd
- 15575 Stillwell Rd
- 16008 Button St
- 14686 Mayfield Rd
- 15410 High Pointe Cir
- 11470 Clay St
- 15111 Timber Ridge Dr
- V/L High Pointe Cir
- 16080 Chardon Windsor Rd
- VL Clay St
- 14452 Burton Windsor Rd
- 16430 Burton Windsor Rd
- 16421 Burton Windsor Rd
- 16440 Burton Windsor Rd
- 16384 Burton Windsor Rd
- 16419 Burton Windsor Rd
- 16419 Burton Windsor Rd
- 13320 Madison Rd
- 16490 Burton Windsor Rd
- 13256 Madison Rd
- 16382 Burton Windsor Rd
- 16360 Burton Windsor Rd
- 16393 Burton Windsor Rd
- 16385 Burton Windsor Rd
- 13374 Madison Rd
- 16345 Burton Windsor Rd
- 16334 Burton Windsor Rd
- 13341 Madison Rd
- 16294 Burton Windsor Rd
- 16355 Burton Windsor Rd
- 13365 Madison Rd