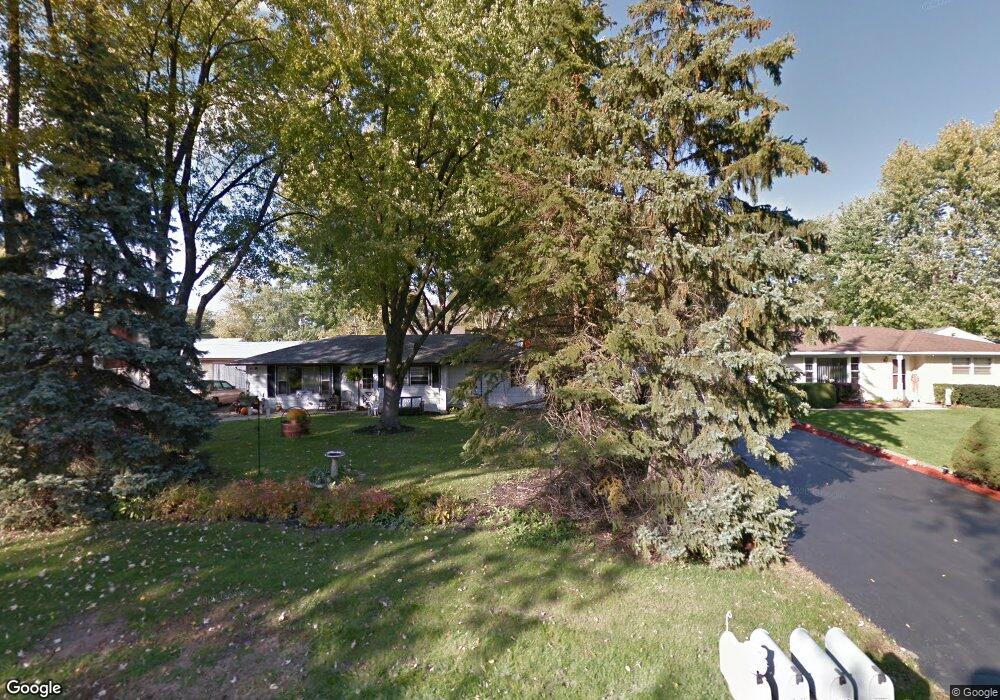
16436 W 146th Place Lockport, IL 60441
Big Run NeighborhoodEstimated Value: $221,836 - $280,000
--
Bed
--
Bath
1,136
Sq Ft
$228/Sq Ft
Est. Value
About This Home
This home is located at 16436 W 146th Place, Lockport, IL 60441 and is currently estimated at $259,459, approximately $228 per square foot. 16436 W 146th Place is a home located in Will County with nearby schools including Ludwig Elementary School, Walsh Elementary School, and Reed Elementary School.
Ownership History
Date
Name
Owned For
Owner Type
Purchase Details
Closed on
Oct 6, 2006
Sold by
Carr Rand Wendy K
Bought by
Garesche Victoria M
Current Estimated Value
Home Financials for this Owner
Home Financials are based on the most recent Mortgage that was taken out on this home.
Original Mortgage
$160,000
Outstanding Balance
$95,422
Interest Rate
6.45%
Mortgage Type
New Conventional
Estimated Equity
$164,037
Purchase Details
Closed on
Jun 19, 2003
Sold by
Pankow Jennie and The Jennie Pankow Self Declara
Bought by
Carr Rand Wendy K
Home Financials for this Owner
Home Financials are based on the most recent Mortgage that was taken out on this home.
Original Mortgage
$132,914
Interest Rate
5.71%
Mortgage Type
Purchase Money Mortgage
Purchase Details
Closed on
Apr 29, 1997
Sold by
Pankow Jennie
Bought by
The Jennie Pankow Self Declaration Of Tr
Create a Home Valuation Report for This Property
The Home Valuation Report is an in-depth analysis detailing your home's value as well as a comparison with similar homes in the area
Home Values in the Area
Average Home Value in this Area
Purchase History
| Date | Buyer | Sale Price | Title Company |
|---|---|---|---|
| Garesche Victoria M | $175,000 | Chicago Title Insurance Co | |
| Carr Rand Wendy K | $135,000 | First American Title | |
| The Jennie Pankow Self Declaration Of Tr | -- | -- |
Source: Public Records
Mortgage History
| Date | Status | Borrower | Loan Amount |
|---|---|---|---|
| Open | Garesche Victoria M | $160,000 | |
| Previous Owner | Carr Rand Wendy K | $132,914 |
Source: Public Records
Tax History Compared to Growth
Tax History
| Year | Tax Paid | Tax Assessment Tax Assessment Total Assessment is a certain percentage of the fair market value that is determined by local assessors to be the total taxable value of land and additions on the property. | Land | Improvement |
|---|---|---|---|---|
| 2024 | $4,638 | $78,439 | $18,904 | $59,535 |
| 2023 | $4,638 | $71,102 | $17,136 | $53,966 |
| 2022 | $3,448 | $55,780 | $13,584 | $42,196 |
| 2021 | $3,257 | $52,847 | $12,870 | $39,977 |
| 2020 | $3,253 | $50,902 | $12,396 | $38,506 |
| 2019 | $3,138 | $48,968 | $11,925 | $37,043 |
| 2018 | $3,071 | $47,339 | $11,788 | $35,551 |
| 2017 | $3,003 | $46,014 | $11,458 | $34,556 |
| 2016 | $2,923 | $44,480 | $11,076 | $33,404 |
| 2015 | $2,744 | $42,810 | $10,660 | $32,150 |
| 2014 | $2,744 | $41,926 | $10,440 | $31,486 |
| 2013 | $2,744 | $41,926 | $10,440 | $31,486 |
Source: Public Records
Map
Nearby Homes
- 14511 S 136th Ave
- 1400 Smith Rd
- 16520 Tameling Dr
- 14739 S Hillside Dr
- Darcy Plan at Oak Valley
- Marianne Plan at Oak Valley
- Charlotte Plan at Oak Valley
- 16505 Golden Valley Ln
- 16515 Golden Valley Ln
- 16435 Golden Valley Ln
- 16509 Golden Valley Ln
- 16507 Golden Valley Ln
- 16100 S Gougar Rd
- 16431 W Golden Valley Ln
- 16433 W Golden Valley Ln
- 14743 S Hillside Dr
- 14741 S Hillside Dr
- 14951 S Preserve Dr
- 14948 S Preserve Dr
- 14903 S Preserve Dr
- 16428 W 146th Place
- 16442 W 146th Place
- 16422 W 146th Place
- 16450 W 146th Place
- 16435 W 145th Place Unit 6
- 16427 W 145th Place Unit 6
- 16441 W 145th Place
- 16421 W 145th Place
- 16449 W 145th Place Unit 6
- 16456 W 146th Place
- 16414 W 146th Place
- 16435 W 146th Place
- 16441 W 146th Place
- 16425 W 146th Place
- 16413 W 145th Place
- 16455 W 145th Place
- 16413 W 146th Place
- 16447 W 146th Place Unit 5
- 16421 W 146th Place
- 16464 W 146th Place Unit 5