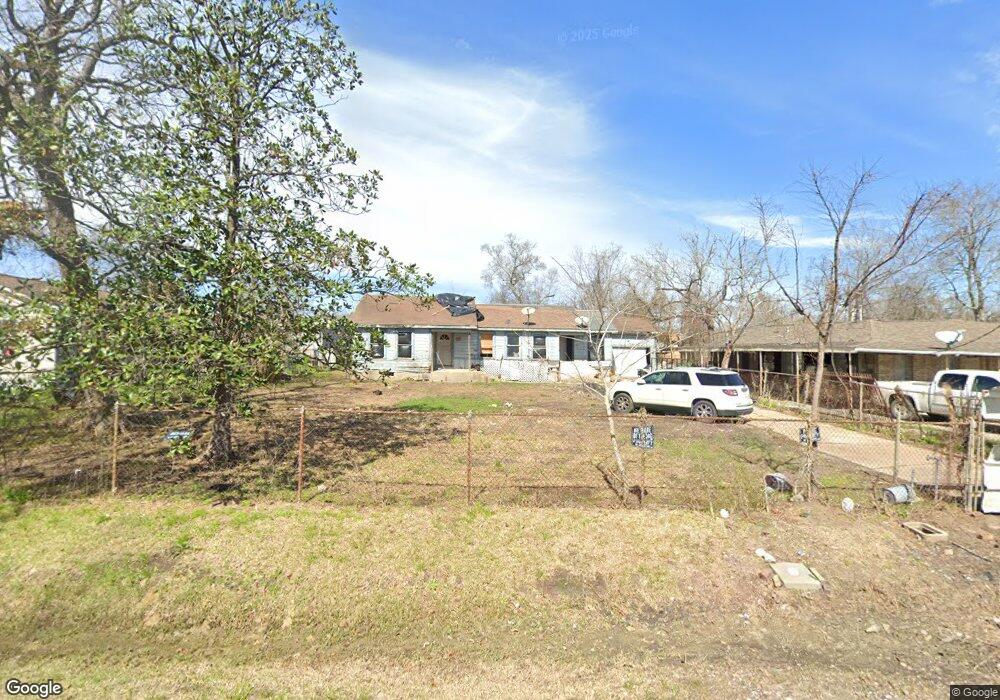
16437 Pecan St Channelview, TX 77530
Estimated Value: $178,000 - $242,000
3
Beds
2
Baths
1,566
Sq Ft
$133/Sq Ft
Est. Value
About This Home
This home is located at 16437 Pecan St, Channelview, TX 77530 and is currently estimated at $208,342, approximately $133 per square foot. 16437 Pecan St is a home located in Harris County with nearby schools including Channelview High School, Family Christian Academy, and San Jacinto Christian Academy.
Ownership History
Date
Name
Owned For
Owner Type
Purchase Details
Closed on
Oct 7, 1999
Sold by
Federal National Mortgage Association
Bought by
Pfirman Richard L
Current Estimated Value
Purchase Details
Closed on
May 4, 1999
Sold by
Mary Carol Raye and Chase Manhattan Mtg Corp
Bought by
Federal National Mortgage Association
Purchase Details
Closed on
Jul 22, 1996
Sold by
Martinez Juan Luis and Martinez Juana
Bought by
Mary Carol Raye
Home Financials for this Owner
Home Financials are based on the most recent Mortgage that was taken out on this home.
Original Mortgage
$46,050
Interest Rate
8.33%
Mortgage Type
Purchase Money Mortgage
Purchase Details
Closed on
Jun 7, 1996
Sold by
Martinez Juan Luis and Martinez Juana
Bought by
Mary Carol Raye
Home Financials for this Owner
Home Financials are based on the most recent Mortgage that was taken out on this home.
Original Mortgage
$46,050
Interest Rate
8.33%
Mortgage Type
Purchase Money Mortgage
Create a Home Valuation Report for This Property
The Home Valuation Report is an in-depth analysis detailing your home's value as well as a comparison with similar homes in the area
Home Values in the Area
Average Home Value in this Area
Purchase History
| Date | Buyer | Sale Price | Title Company |
|---|---|---|---|
| Pfirman Richard L | -- | American Title Co | |
| Federal National Mortgage Association | $48,245 | -- | |
| Mary Carol Raye | -- | Houston Title | |
| Mary Carol Raye | -- | Houston Title |
Source: Public Records
Mortgage History
| Date | Status | Borrower | Loan Amount |
|---|---|---|---|
| Previous Owner | Mary Carol Raye | $46,050 | |
| Previous Owner | Mary Carol Raye | $46,050 |
Source: Public Records
Tax History Compared to Growth
Tax History
| Year | Tax Paid | Tax Assessment Tax Assessment Total Assessment is a certain percentage of the fair market value that is determined by local assessors to be the total taxable value of land and additions on the property. | Land | Improvement |
|---|---|---|---|---|
| 2025 | $4,072 | $199,709 | $70,131 | $129,578 |
| 2024 | $4,072 | $199,709 | $70,131 | $129,578 |
| 2023 | $4,072 | $203,271 | $56,104 | $147,167 |
| 2022 | $3,754 | $130,000 | $36,467 | $93,533 |
| 2021 | $2,844 | $117,387 | $36,467 | $80,920 |
| 2020 | $2,183 | $85,000 | $30,858 | $54,142 |
| 2019 | $2,233 | $97,393 | $30,858 | $66,535 |
| 2018 | $614 | $50,000 | $10,519 | $39,481 |
| 2017 | $1,315 | $50,000 | $10,519 | $39,481 |
| 2016 | $1,315 | $50,000 | $10,519 | $39,481 |
| 2015 | $1,382 | $70,698 | $10,519 | $60,179 |
| 2014 | $1,382 | $51,491 | $10,519 | $40,972 |
Source: Public Records
Map
Nearby Homes
- 16516 Market St
- 16534 Market St
- 108 Cedar Ln
- 16809 Market St
- 812 Coolidge St
- 908 Lakeside Dr
- 431 Crockett St
- 16305 De Zavalla Rd
- 16032 1/2 Ridlon St
- 16931 Avenue B
- 16023 Ridlon St
- 523 Sheldon Rd
- 0 Laurelwood Dr Unit 43034610
- 16736 Forest Trail Dr
- 16134 Palm St
- 16811 Forest Trail Dr
- 00 Laurelwood Dr
- 16600 Laurelwood Dr
- 1109 Becker St
- 822 Woodhue St