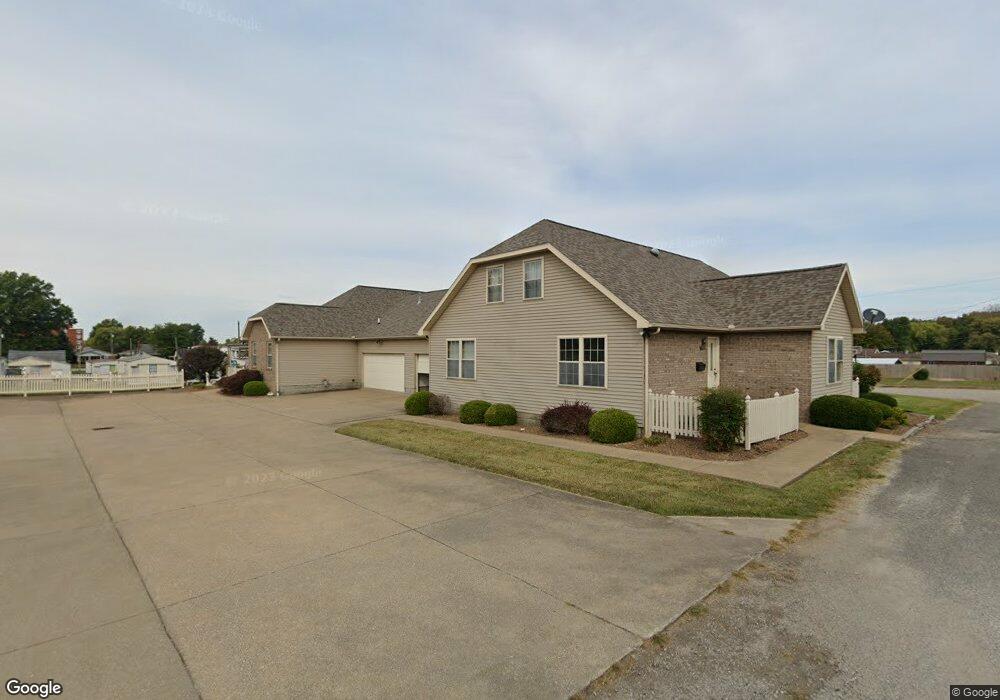
1644 13th St Tell City, IN 47586
Estimated Value: $153,000 - $219,000
2
Beds
3
Baths
2,119
Sq Ft
$93/Sq Ft
Est. Value
About This Home
This home is located at 1644 13th St, Tell City, IN 47586 and is currently estimated at $196,799, approximately $92 per square foot. 1644 13th St is a home located in Perry County with nearby schools including William Tell Elementary School, Tell City Junior/Senior High School, and Agape Christian Academy.
Ownership History
Date
Name
Owned For
Owner Type
Purchase Details
Closed on
May 9, 2017
Sold by
Carney David James
Bought by
Lucys Rentals Llc
Current Estimated Value
Purchase Details
Closed on
May 2, 2007
Sold by
Carney Carolyn and Hitch Charles
Bought by
Carney David James
Home Financials for this Owner
Home Financials are based on the most recent Mortgage that was taken out on this home.
Original Mortgage
$84,000
Interest Rate
6.37%
Mortgage Type
Adjustable Rate Mortgage/ARM
Create a Home Valuation Report for This Property
The Home Valuation Report is an in-depth analysis detailing your home's value as well as a comparison with similar homes in the area
Home Values in the Area
Average Home Value in this Area
Purchase History
| Date | Buyer | Sale Price | Title Company |
|---|---|---|---|
| Lucys Rentals Llc | -- | None Available | |
| Carney David James | -- | None Available |
Source: Public Records
Mortgage History
| Date | Status | Borrower | Loan Amount |
|---|---|---|---|
| Previous Owner | Carney David James | $84,000 |
Source: Public Records
Tax History Compared to Growth
Tax History
| Year | Tax Paid | Tax Assessment Tax Assessment Total Assessment is a certain percentage of the fair market value that is determined by local assessors to be the total taxable value of land and additions on the property. | Land | Improvement |
|---|---|---|---|---|
| 2024 | $2,922 | $146,100 | $8,000 | $138,100 |
| 2023 | $2,810 | $140,500 | $8,000 | $132,500 |
| 2022 | $2,780 | $139,000 | $8,000 | $131,000 |
| 2021 | $2,310 | $115,500 | $8,000 | $107,500 |
| 2020 | $2,156 | $107,800 | $8,000 | $99,800 |
| 2019 | $2,116 | $105,800 | $8,000 | $97,800 |
| 2018 | $2,074 | $103,700 | $8,000 | $95,700 |
| 2017 | $2,040 | $102,000 | $8,000 | $94,000 |
| 2016 | $2,062 | $103,100 | $8,000 | $95,100 |
| 2014 | $2,070 | $103,500 | $8,000 | $95,500 |
| 2013 | $2,070 | $100,400 | $6,000 | $94,400 |
Source: Public Records
Map
Nearby Homes