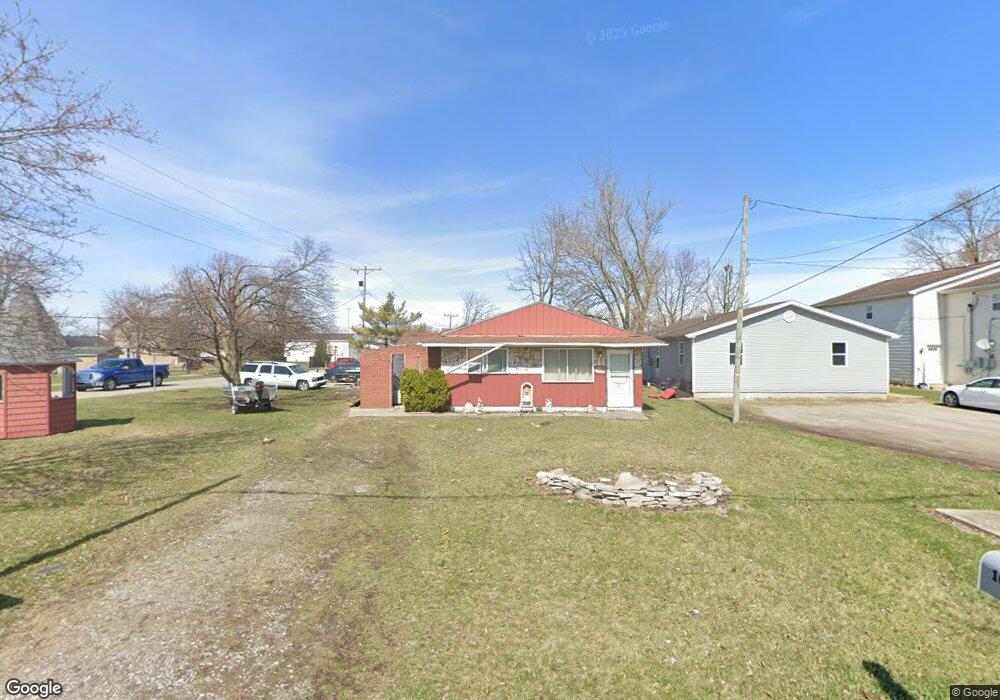
1644 Foraker Ave Findlay, OH 45840
Estimated Value: $104,000 - $185,000
5
Beds
2
Baths
1,610
Sq Ft
$90/Sq Ft
Est. Value
About This Home
This home is located at 1644 Foraker Ave, Findlay, OH 45840 and is currently estimated at $144,578, approximately $89 per square foot. 1644 Foraker Ave is a home located in Hancock County with nearby schools including Chamberlin Hill Elementary School, Jefferson Elementary School, and Donnell Middle School.
Ownership History
Date
Name
Owned For
Owner Type
Purchase Details
Closed on
Dec 11, 2009
Sold by
Secretary Of Housing & Urban Development
Bought by
Smith Kenneth A
Current Estimated Value
Purchase Details
Closed on
Aug 20, 2009
Sold by
Bac Home Loans Servicing Lp
Bought by
The Secretary Department Of Housing & Ur
Purchase Details
Closed on
Aug 5, 2009
Sold by
Young Tony A and Young Lindsey S
Bought by
Bac Home Loans Servicing Lp
Purchase Details
Closed on
Nov 30, 2007
Sold by
Sherard Rayleah
Bought by
Young Tonya A and Young Lindsey A
Home Financials for this Owner
Home Financials are based on the most recent Mortgage that was taken out on this home.
Original Mortgage
$64,980
Interest Rate
6.33%
Mortgage Type
FHA
Purchase Details
Closed on
Oct 13, 2004
Sold by
Sherard Stella M
Bought by
Sherard Rayleah and Sherard Diva
Create a Home Valuation Report for This Property
The Home Valuation Report is an in-depth analysis detailing your home's value as well as a comparison with similar homes in the area
Home Values in the Area
Average Home Value in this Area
Purchase History
| Date | Buyer | Sale Price | Title Company |
|---|---|---|---|
| Smith Kenneth A | $11,126 | Lakeside Title & Escrow | |
| The Secretary Department Of Housing & Ur | -- | Attorney | |
| Bac Home Loans Servicing Lp | $21,334 | Attorney | |
| Young Tonya A | $33,000 | Mid Am Title Agency | |
| Young Tony A | $33,000 | Mid Am Title Agency | |
| Sherard Rayleah | -- | -- |
Source: Public Records
Mortgage History
| Date | Status | Borrower | Loan Amount |
|---|---|---|---|
| Previous Owner | Young Tonya A | $64,980 |
Source: Public Records
Tax History Compared to Growth
Tax History
| Year | Tax Paid | Tax Assessment Tax Assessment Total Assessment is a certain percentage of the fair market value that is determined by local assessors to be the total taxable value of land and additions on the property. | Land | Improvement |
|---|---|---|---|---|
| 2024 | $993 | $27,940 | $3,870 | $24,070 |
| 2023 | $994 | $27,940 | $3,870 | $24,070 |
| 2022 | $991 | $27,940 | $3,870 | $24,070 |
| 2021 | $931 | $22,880 | $3,990 | $18,890 |
| 2020 | $931 | $22,880 | $3,990 | $18,890 |
| 2019 | $912 | $22,880 | $3,990 | $18,890 |
| 2018 | $805 | $15,550 | $3,990 | $11,560 |
| 2017 | $676 | $22,570 | $3,990 | $18,580 |
| 2016 | $1,202 | $15,550 | $3,990 | $11,560 |
| 2015 | $987 | $22,570 | $3,990 | $18,580 |
| 2014 | $987 | $22,570 | $3,990 | $18,580 |
| 2012 | $995 | $22,570 | $3,990 | $18,580 |
Source: Public Records
Map
Nearby Homes
- 1609 Foraker Ave
- 0 Bushwillow Dr Unit Lot 156
- 0 Bushwillow Dr Unit Lot 155
- 0 Bushwillow Dr Unit Lot 154
- 0 County Road 99 Lot 2 Unit 6081480
- 0 Rock Candy Rd Or Bushwillow Dr Lot 173 Unit 6079093
- 0 Rock Candy Rd Lot 171 Unit 6079088
- 0 Rock Candy Rd Lot 170 Unit 6079087
- 0 Rock Candy Rd Lot 168 Unit 6079085
- 0 Bearcat Way Or 0 Rock Candy Rd Lot 167 Unit 6079083
- 0 Rock Candy Rd Lot 162 Unit 6079070
- 0 Rock Candy Rd Lot 159 Unit 6079053
- 0 Bushwillow Dr Or Rock Candy Rd Lot 157 Unit 6079052
- 0 Bushwillow Dr Lot 156 Unit 6079046
- 0 Bushwillow Dr Lot 155 Unit 6079044
- 0 Bushwillow Dr Lot 154 Unit 6079043
- 0 Waterford Way Lot 78 Unit 6089639
- 535 Palm Dr
- 9653 Early Dr
- 10601 County Road 9
- 1636 Foraker Ave
- 1632 Foraker Ave
- 1641 Byal Ave
- 1628 Foraker Ave
- 1700 Foraker Ave
- 1700 Foraker Ave
- 1637 Byal Ave
- 1639 Foraker Ave
- 1707 Byal Ave
- 1635 Byal Ave
- 1633 Foraker Ave
- 0 Foraker Ave Unit H115081
- 0 Foraker Ave Unit H114671
- 0 Foraker Ave
- 1620 Foraker Ave
- 1709 Byal Ave
- 1714 Foraker Ave
- 216 Potomac Dr Unit 6
- 1621 Byal Ave