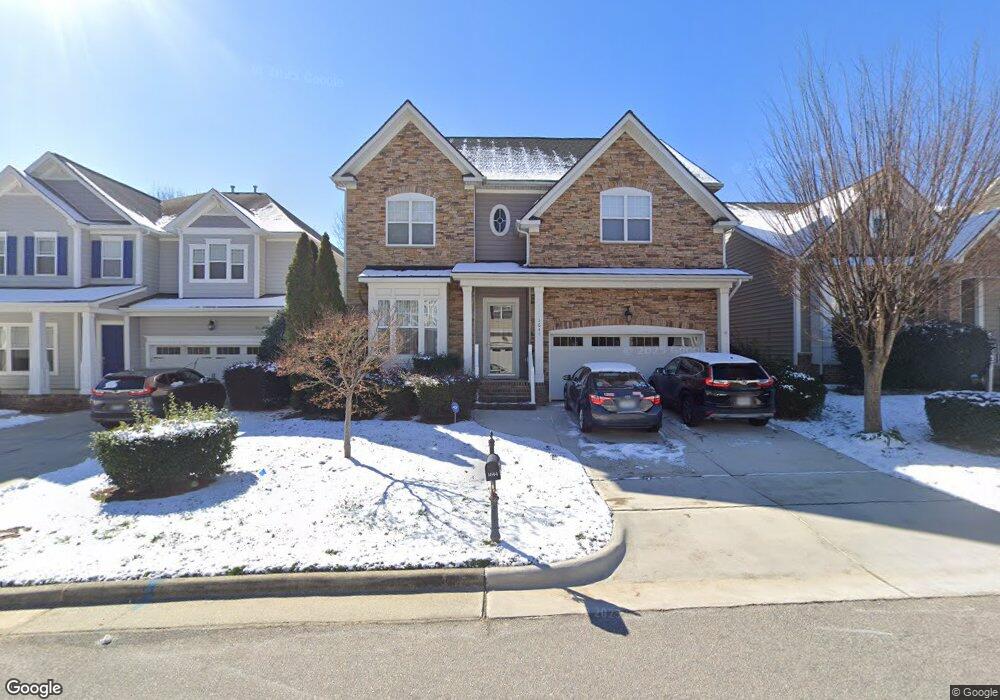
1644 Laurel Park Place Unit 10 Cary, NC 27511
South Cary NeighborhoodEstimated Value: $672,247 - $748,000
4
Beds
4
Baths
2,786
Sq Ft
$258/Sq Ft
Est. Value
About This Home
This home is located at 1644 Laurel Park Place Unit 10, Cary, NC 27511 and is currently estimated at $718,812, approximately $258 per square foot. 1644 Laurel Park Place Unit 10 is a home located in Wake County with nearby schools including Laurel Park Elementary, Salem Middle, and Apex High School.
Ownership History
Date
Name
Owned For
Owner Type
Purchase Details
Closed on
Oct 21, 2012
Sold by
Robinson William and Robinson Sheryl
Bought by
The Sheryl Robinson And Williams J Robin
Current Estimated Value
Purchase Details
Closed on
Oct 28, 2011
Sold by
Tvedt Michele and Tvedt Eric
Bought by
Robinson William and Robinson Sheryl
Home Financials for this Owner
Home Financials are based on the most recent Mortgage that was taken out on this home.
Original Mortgage
$281,790
Interest Rate
4.4%
Mortgage Type
FHA
Purchase Details
Closed on
Apr 30, 2008
Sold by
Standard Pacific Of The Carolinas Llc
Bought by
Tvedt Michele and Tvedt Eric
Home Financials for this Owner
Home Financials are based on the most recent Mortgage that was taken out on this home.
Original Mortgage
$155,251
Interest Rate
5.84%
Mortgage Type
Purchase Money Mortgage
Create a Home Valuation Report for This Property
The Home Valuation Report is an in-depth analysis detailing your home's value as well as a comparison with similar homes in the area
Home Values in the Area
Average Home Value in this Area
Purchase History
| Date | Buyer | Sale Price | Title Company |
|---|---|---|---|
| The Sheryl Robinson And Williams J Robin | -- | None Available | |
| Robinson William | $310,000 | None Available | |
| Tvedt Michele | $335,000 | Sterling Title Company |
Source: Public Records
Mortgage History
| Date | Status | Borrower | Loan Amount |
|---|---|---|---|
| Previous Owner | Robinson William | $281,790 | |
| Previous Owner | Tvedt Michele | $155,251 |
Source: Public Records
Tax History Compared to Growth
Tax History
| Year | Tax Paid | Tax Assessment Tax Assessment Total Assessment is a certain percentage of the fair market value that is determined by local assessors to be the total taxable value of land and additions on the property. | Land | Improvement |
|---|---|---|---|---|
| 2025 | $5,067 | $588,902 | $150,000 | $438,902 |
| 2024 | $4,958 | $588,902 | $150,000 | $438,902 |
| 2023 | $4,100 | $407,166 | $90,000 | $317,166 |
| 2022 | $3,947 | $407,166 | $90,000 | $317,166 |
| 2021 | $3,868 | $407,166 | $90,000 | $317,166 |
| 2020 | $3,888 | $407,166 | $90,000 | $317,166 |
| 2019 | $4,050 | $376,394 | $78,000 | $298,394 |
| 2018 | $3,801 | $376,394 | $78,000 | $298,394 |
| 2017 | $3,652 | $376,394 | $78,000 | $298,394 |
| 2016 | $3,598 | $376,394 | $78,000 | $298,394 |
| 2015 | $2,674 | $360,061 | $60,000 | $300,061 |
| 2014 | -- | $360,061 | $60,000 | $300,061 |
Source: Public Records
Map
Nearby Homes
- 2120 Royal Berry Ct
- 3040 Kilarney Ridge Loop
- 717 Sweet Laurel Ln
- 728 Blossom Bay Ln
- 1016 Kilarney Ridge Loop
- 1710 Burnley Dr
- 802 New Derby Ln
- 116 Lost Tree Ln
- 114 Colchis Ct
- 835 New Derby Ln
- 900 Bay Bouquet Ln
- 1531 Salem Church Rd
- 215 Pointe Crest Ct
- 1529 Salem Church Rd
- 209 Smokemont Dr
- 101 Solway Ct
- 1009 Tahoe Glen Place
- 532 Applecross Dr
- 317 Arvo Ln
- 126 Hidden Bluff Ln
- 1644 Laurel Park Place
- 1640 Laurel Park Place
- 1654 Laurel Park Place
- 1636 Laurel Park Place
- 2112 Royal Berry Ct
- 2108 Royal Berry Ct
- 2116 Royal Berry Ct
- 1632 Laurel Park Place
- 1641 Laurel Park Place
- 1637 Laurel Park Place
- 1645 Laurel Park Place
- 2104 Royal Berry Ct
- 2124 Royal Berry Ct
- 1633 Laurel Park Place
- 1628 Laurel Park Place
- 1628 Laurel Park Place Unit 6
- 1649 Laurel Park Place
- 1653 Laurel Park Place
- 1653 Laurel Park Place Unit 69
- 1629 Laurel Park Place