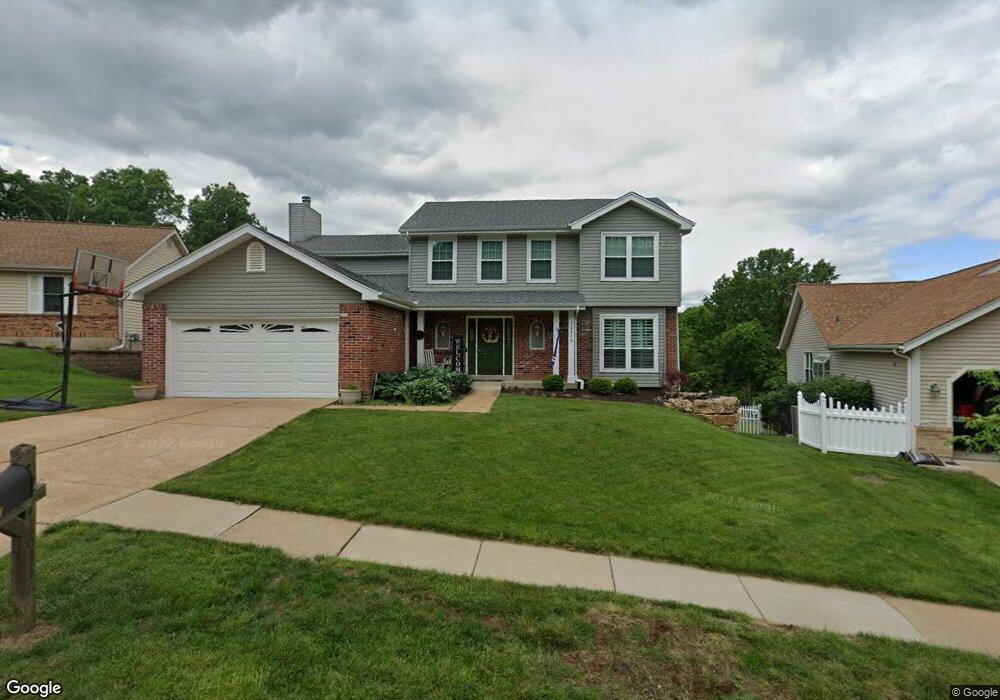
16446 Hollister Crossing Dr Ballwin, MO 63011
Estimated Value: $413,000 - $469,000
4
Beds
3
Baths
2,519
Sq Ft
$176/Sq Ft
Est. Value
About This Home
This home is located at 16446 Hollister Crossing Dr, Ballwin, MO 63011 and is currently estimated at $443,704, approximately $176 per square foot. 16446 Hollister Crossing Dr is a home located in St. Louis County with nearby schools including Green Pines Elementary School, Wildwood Middle School, and Lafayette High School.
Ownership History
Date
Name
Owned For
Owner Type
Purchase Details
Closed on
Nov 22, 2004
Sold by
Swank Timothy P and Swank Cara A
Bought by
Lamp Michael D and Lamp Kelly
Current Estimated Value
Home Financials for this Owner
Home Financials are based on the most recent Mortgage that was taken out on this home.
Original Mortgage
$145,000
Outstanding Balance
$72,070
Interest Rate
5.72%
Mortgage Type
Purchase Money Mortgage
Estimated Equity
$371,634
Purchase Details
Closed on
Jul 31, 2001
Sold by
Hunsicker Brian and Hunsicker Joanne
Bought by
Swank Timothy P and Swank Cara A
Home Financials for this Owner
Home Financials are based on the most recent Mortgage that was taken out on this home.
Original Mortgage
$202,817
Interest Rate
7.14%
Mortgage Type
VA
Create a Home Valuation Report for This Property
The Home Valuation Report is an in-depth analysis detailing your home's value as well as a comparison with similar homes in the area
Home Values in the Area
Average Home Value in this Area
Purchase History
| Date | Buyer | Sale Price | Title Company |
|---|---|---|---|
| Lamp Michael D | $225,000 | -- | |
| Swank Timothy P | $203,900 | -- |
Source: Public Records
Mortgage History
| Date | Status | Borrower | Loan Amount |
|---|---|---|---|
| Open | Lamp Michael D | $145,000 | |
| Previous Owner | Swank Timothy P | $202,817 | |
| Closed | Lamp Michael D | $57,500 |
Source: Public Records
Tax History Compared to Growth
Tax History
| Year | Tax Paid | Tax Assessment Tax Assessment Total Assessment is a certain percentage of the fair market value that is determined by local assessors to be the total taxable value of land and additions on the property. | Land | Improvement |
|---|---|---|---|---|
| 2025 | $4,520 | $66,630 | $23,860 | $42,770 |
| 2024 | $4,520 | $65,000 | $17,900 | $47,100 |
| 2023 | $4,516 | $65,000 | $17,900 | $47,100 |
| 2022 | $4,210 | $56,280 | $14,920 | $41,360 |
| 2021 | $4,179 | $56,280 | $14,920 | $41,360 |
| 2020 | $3,853 | $49,470 | $13,430 | $36,040 |
| 2019 | $3,868 | $49,470 | $13,430 | $36,040 |
| 2018 | $3,860 | $46,550 | $11,190 | $35,360 |
| 2017 | $3,768 | $46,550 | $11,190 | $35,360 |
| 2016 | $3,467 | $41,190 | $9,710 | $31,480 |
| 2015 | $3,396 | $41,190 | $9,710 | $31,480 |
| 2014 | $3,796 | $44,900 | $8,550 | $36,350 |
Source: Public Records
Map
Nearby Homes
- 2452 Autumn Pines Dr
- 2531 Elm Forest Ct
- 2551 Forest Leaf Pkwy
- 16307 Autumn View Terrace Dr
- 375 Thunderhead Canyon Dr
- 16567 Thunderhead Canyon Ct
- 16621 Green Pines Dr
- 16672 Westglen Farms Dr
- 2003 Centennial Ct
- 2381 Gross Point Ln
- 116 Sweet Cherry Way
- 112 Boathouse Dr
- 2308 Sand Cherry Dr
- 16773 Babler View Dr
- 2583 Hickory Manor Dr
- 1640 Timber Hollow Dr
- 17065 Sandalwood Creek Dr Unit A
- 16509 Carriage View Ct
- 2424 Eatherton Rd
- 1640 Sunnyridge Rd
- 16450 Hollister Crossing Dr
- 16442 Hollister Crossing Dr
- 16454 Hollister Crossing Dr
- 16438 Hollister Crossing Dr
- 16449 Hollister Crossing Dr
- 16437 Hollister Crossing Dr
- 16455 Hollister Crossing Dr
- 16458 Hollister Crossing Dr
- 16459 Hollister Crossing Dr
- 16427 Hollister Crossing Dr
- 16430 Hollister Crossing Dr
- 16463 Hollister Crossing Dr
- 16421 Hollister Crossing Dr
- 16466 Hollister Crossing Dr
- 2403 Peaceful Ct
- 16469 Forest Pine Dr
- 16426 Hollister Crossing Dr
- 16473 Forest Pine Dr
- 16467 Hollister Crossing Dr
- 16465 Forest Pine Dr