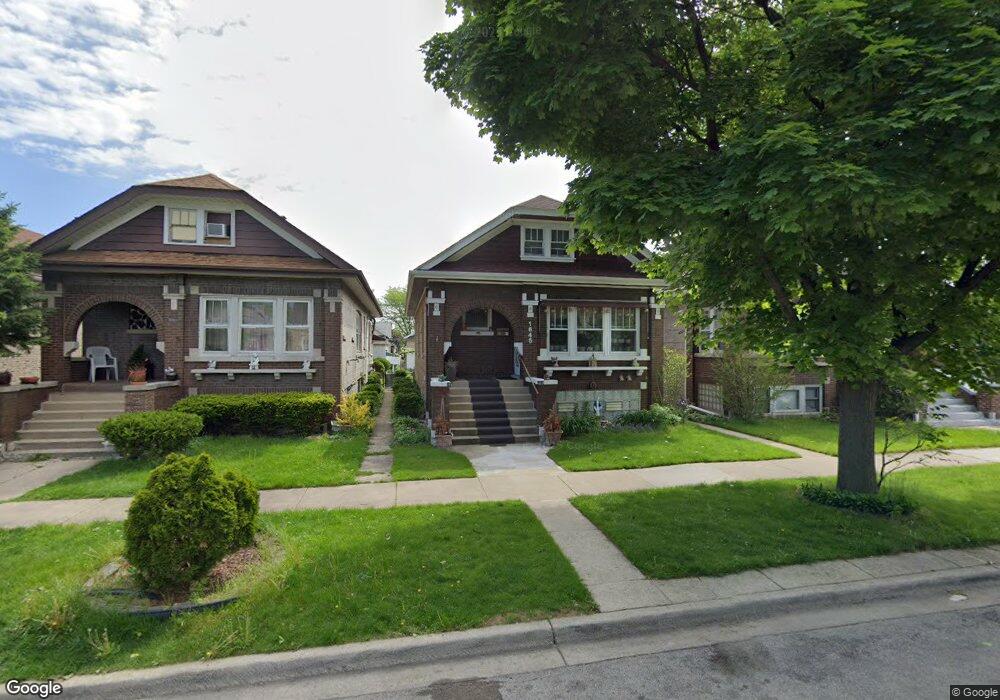
1645 Cuyler Ave Berwyn, IL 60402
Estimated Value: $289,000 - $331,000
3
Beds
1
Bath
1,044
Sq Ft
$293/Sq Ft
Est. Value
About This Home
This home is located at 1645 Cuyler Ave, Berwyn, IL 60402 and is currently estimated at $306,006, approximately $293 per square foot. 1645 Cuyler Ave is a home located in Cook County with nearby schools including Karel Havlicek Elementary School, Lincoln Middle School, and J Sterling Morton West High School.
Ownership History
Date
Name
Owned For
Owner Type
Purchase Details
Closed on
Sep 24, 2012
Sold by
Cesar Hablero Luzviminda C and Hablero J Cesar T
Bought by
Casar Hablero Luziminda C and Hablero J Casar T
Current Estimated Value
Purchase Details
Closed on
Jun 19, 2001
Sold by
Gutierrez Jaime and Gutierrez Edna
Bought by
Hablero Luzviminda C and Hablero Cedar T
Home Financials for this Owner
Home Financials are based on the most recent Mortgage that was taken out on this home.
Original Mortgage
$162,650
Outstanding Balance
$61,821
Interest Rate
7.11%
Mortgage Type
FHA
Estimated Equity
$244,185
Purchase Details
Closed on
Apr 18, 1996
Sold by
Sciara Joseph P and Sciara Emerita T
Bought by
Gutierrez Jaime and Gutierrez Edna
Home Financials for this Owner
Home Financials are based on the most recent Mortgage that was taken out on this home.
Original Mortgage
$116,900
Interest Rate
7.91%
Mortgage Type
FHA
Create a Home Valuation Report for This Property
The Home Valuation Report is an in-depth analysis detailing your home's value as well as a comparison with similar homes in the area
Home Values in the Area
Average Home Value in this Area
Purchase History
| Date | Buyer | Sale Price | Title Company |
|---|---|---|---|
| Casar Hablero Luziminda C | -- | None Available | |
| Hablero Luzviminda C | $165,500 | -- | |
| Gutierrez Jaime | $118,000 | Intercounty Title |
Source: Public Records
Mortgage History
| Date | Status | Borrower | Loan Amount |
|---|---|---|---|
| Open | Hablero Luzviminda C | $162,650 | |
| Previous Owner | Gutierrez Jaime | $116,900 |
Source: Public Records
Tax History Compared to Growth
Tax History
| Year | Tax Paid | Tax Assessment Tax Assessment Total Assessment is a certain percentage of the fair market value that is determined by local assessors to be the total taxable value of land and additions on the property. | Land | Improvement |
|---|---|---|---|---|
| 2024 | $5,041 | $22,000 | $5,859 | $16,141 |
| 2023 | $5,365 | $22,000 | $5,859 | $16,141 |
| 2022 | $5,365 | $19,544 | $5,078 | $14,466 |
| 2021 | $5,171 | $19,542 | $5,077 | $14,465 |
| 2020 | $5,188 | $19,542 | $5,077 | $14,465 |
| 2019 | $3,833 | $15,466 | $4,589 | $10,877 |
| 2018 | $3,678 | $15,466 | $4,589 | $10,877 |
| 2017 | $3,606 | $15,466 | $4,589 | $10,877 |
| 2016 | $5,579 | $13,191 | $3,808 | $9,383 |
| 2015 | $3,609 | $13,191 | $3,808 | $9,383 |
| 2014 | $5,322 | $13,191 | $3,808 | $9,383 |
| 2013 | $5,333 | $14,868 | $3,808 | $11,060 |
Source: Public Records
Map
Nearby Homes
- 1855 Ridgeland Ave
- 1805 Elmwood Ave
- 1842 Elmwood Ave
- 1523 Cuyler Ave
- 1938 Highland Ave
- 1935 Harvey Ave
- 1910 S 61st Ct
- 1505 Highland Ave
- 1644 Gunderson Ave
- 1820 Gunderson Ave
- 2114 Highland Ave
- 2127 Highland Ave
- 1440 Cuyler Ave
- 1521 Gunderson Ave
- 1426 Harvey Ave
- 1807 East Ave
- 1501 S 61st Ct
- 2102 Gunderson Ave
- 1906 S 60th Ct
- 1413 Cuyler Ave
- 1643 Cuyler Ave
- 1647 Cuyler Ave
- 1641 Cuyler Ave
- 1637 Cuyler Ave
- 1635 Cuyler Ave
- 1801 Cuyler Ave
- 1646 Highland Ave
- 1648 Highland Ave
- 1642 Highland Ave
- 1633 Cuyler Ave
- 1640 Highland Ave
- 1805 Cuyler Ave
- 1638 Highland Ave
- 1646 Cuyler Ave
- 1631 Cuyler Ave
- 1648 Cuyler Ave
- 1636 Highland Ave
- 1800 Highland Ave
- 1646 Cuyler Ave
- 1642 Cuyler Ave