Estimated Value: $122,000 - $142,000
3
Beds
1
Bath
1,133
Sq Ft
$119/Sq Ft
Est. Value
About This Home
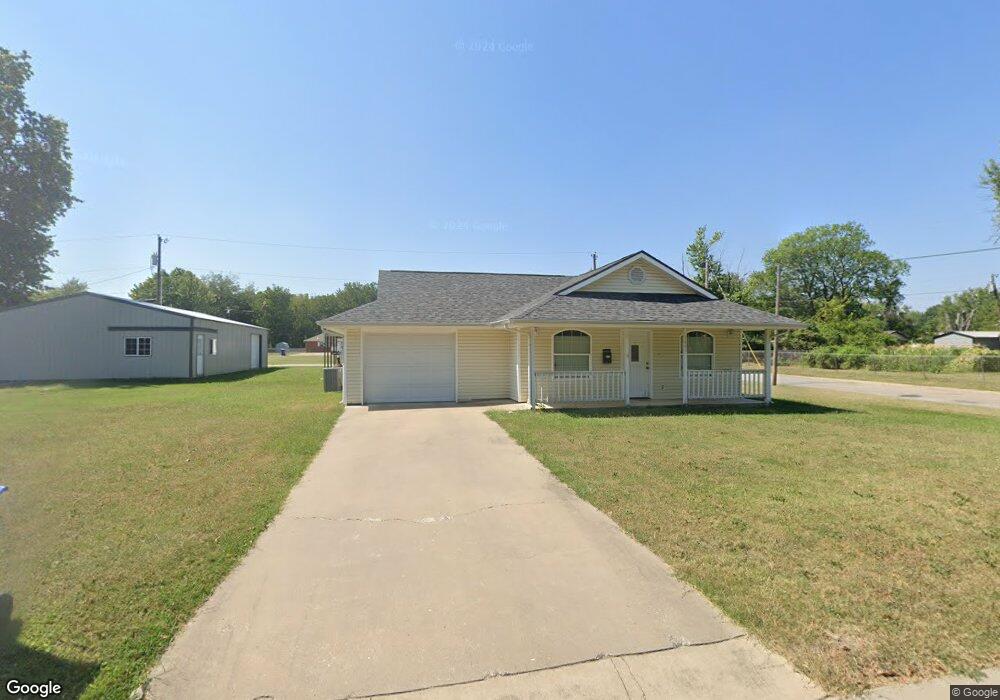
This home is located at 1645 D St NE, Miami, OK 74354 and is currently estimated at $134,678, approximately $118 per square foot. 1645 D St NE is a home located in Ottawa County with nearby schools including Miami High School and Mt. Olive Lutheran School.
Ownership History
Date
Name
Owned For
Owner Type
Purchase Details
Closed on
Apr 23, 2012
Sold by
Read Sandra Frances and The William Joseph Holden Revo
Bought by
Cantwell Brett Edward and Cantwell Whitney Richelle
Current Estimated Value
Home Financials for this Owner
Home Financials are based on the most recent Mortgage that was taken out on this home.
Original Mortgage
$78,571
Outstanding Balance
$54,423
Interest Rate
3.97%
Mortgage Type
New Conventional
Estimated Equity
$80,255
Purchase Details
Closed on
Jun 25, 1999
Bought by
Hinkle Dorothy
Create a Home Valuation Report for This Property
The Home Valuation Report is an in-depth analysis detailing your home's value as well as a comparison with similar homes in the area
Home Values in the Area
Average Home Value in this Area
Purchase History
| Date | Buyer | Sale Price | Title Company |
|---|---|---|---|
| Cantwell Brett Edward | $73,000 | None Available | |
| Hinkle Dorothy | $6,000 | -- |
Source: Public Records
Mortgage History
| Date | Status | Borrower | Loan Amount |
|---|---|---|---|
| Open | Cantwell Brett Edward | $78,571 |
Source: Public Records
Tax History Compared to Growth
Tax History
| Year | Tax Paid | Tax Assessment Tax Assessment Total Assessment is a certain percentage of the fair market value that is determined by local assessors to be the total taxable value of land and additions on the property. | Land | Improvement |
|---|---|---|---|---|
| 2025 | $867 | $10,292 | $849 | $9,443 |
| 2024 | $867 | $9,992 | $824 | $9,168 |
| 2023 | $867 | $9,700 | $822 | $8,878 |
| 2022 | $778 | $9,418 | $820 | $8,598 |
| 2021 | $770 | $9,144 | $817 | $8,327 |
| 2020 | $751 | $8,877 | $814 | $8,063 |
| 2019 | $626 | $8,619 | $804 | $7,815 |
| 2018 | $630 | $8,619 | $804 | $7,815 |
| 2017 | $640 | $8,619 | $804 | $7,815 |
| 2016 | $629 | $8,829 | $802 | $8,027 |
| 2015 | $881 | $9,918 | $599 | $9,319 |
| 2014 | $620 | $8,572 | $554 | $8,018 |
Source: Public Records
Map
Nearby Homes