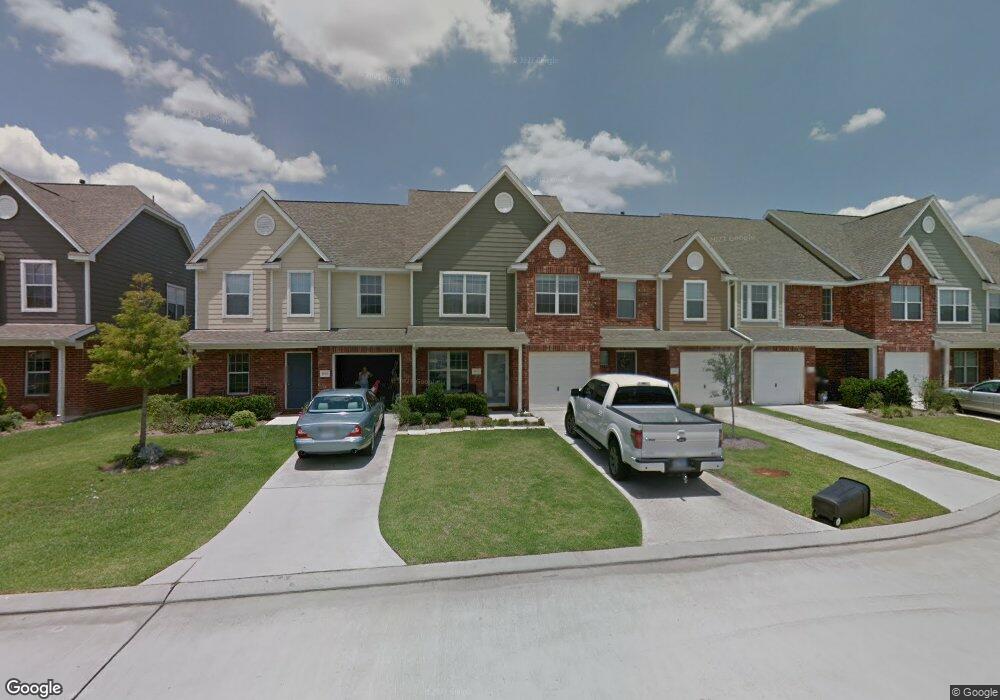
1645 Grable Cove Ln Spring, TX 77379
Gleannloch Farms NeighborhoodEstimated Value: $223,623 - $252,000
2
Beds
3
Baths
1,593
Sq Ft
$151/Sq Ft
Est. Value
About This Home
This home is located at 1645 Grable Cove Ln, Spring, TX 77379 and is currently estimated at $239,906, approximately $150 per square foot. 1645 Grable Cove Ln is a home located in Harris County with nearby schools including Frank Elementary School, Doerre Intermediate School, and Klein Cain High School.
Ownership History
Date
Name
Owned For
Owner Type
Purchase Details
Closed on
Sep 17, 2020
Sold by
Blackburn Jason Cody and Blackburn Taryn Somers
Bought by
Oneal Kendra
Current Estimated Value
Home Financials for this Owner
Home Financials are based on the most recent Mortgage that was taken out on this home.
Original Mortgage
$178,703
Outstanding Balance
$157,928
Interest Rate
2.8%
Mortgage Type
FHA
Estimated Equity
$81,978
Purchase Details
Closed on
Apr 24, 2017
Sold by
Volkert Jason R
Bought by
Blackburn Jason Cody
Home Financials for this Owner
Home Financials are based on the most recent Mortgage that was taken out on this home.
Original Mortgage
$155,138
Interest Rate
4.37%
Mortgage Type
FHA
Purchase Details
Closed on
Jan 16, 2007
Sold by
Pasquinelli Portrait Homes Havenwood Lp
Bought by
Volkert Jason R
Home Financials for this Owner
Home Financials are based on the most recent Mortgage that was taken out on this home.
Original Mortgage
$106,272
Interest Rate
6.19%
Mortgage Type
Purchase Money Mortgage
Create a Home Valuation Report for This Property
The Home Valuation Report is an in-depth analysis detailing your home's value as well as a comparison with similar homes in the area
Home Values in the Area
Average Home Value in this Area
Purchase History
| Date | Buyer | Sale Price | Title Company |
|---|---|---|---|
| Oneal Kendra | -- | Capital Title | |
| Blackburn Jason Cody | -- | None Available | |
| Volkert Jason R | -- | Chicago Title |
Source: Public Records
Mortgage History
| Date | Status | Borrower | Loan Amount |
|---|---|---|---|
| Open | Oneal Kendra | $178,703 | |
| Previous Owner | Blackburn Jason Cody | $155,138 | |
| Previous Owner | Volkert Jason R | $106,272 |
Source: Public Records
Tax History Compared to Growth
Tax History
| Year | Tax Paid | Tax Assessment Tax Assessment Total Assessment is a certain percentage of the fair market value that is determined by local assessors to be the total taxable value of land and additions on the property. | Land | Improvement |
|---|---|---|---|---|
| 2025 | $4,641 | $215,831 | $36,792 | $179,039 |
| 2024 | $4,641 | $211,777 | $36,792 | $174,985 |
| 2023 | $4,641 | $236,541 | $36,792 | $199,749 |
| 2022 | $5,039 | $208,688 | $36,792 | $171,896 |
| 2021 | $4,234 | $162,140 | $29,894 | $132,246 |
| 2020 | $4,457 | $162,140 | $29,894 | $132,246 |
| 2019 | $4,503 | $156,984 | $29,894 | $127,090 |
| 2018 | $2,141 | $149,705 | $29,894 | $119,811 |
| 2017 | $4,316 | $149,705 | $29,894 | $119,811 |
| 2016 | $3,959 | $137,327 | $29,894 | $107,433 |
| 2015 | $3,435 | $137,327 | $29,894 | $107,433 |
| 2014 | $3,435 | $118,003 | $29,894 | $88,109 |
Source: Public Records
Map
Nearby Homes
- 1618 Grable Cove Ln
- 1606 Grable Cove Ln
- 1415 Kennoway Park Dr
- 9822 Blue Cruls Way
- 19807 Wild Poppy Dr
- 23 Perennial Canyon Dr
- 1615 Noble Pointe Dr
- 19902 Tidy Tips Ln
- 10138 Cairn Meadows Dr
- 20008 Champion Forest Dr Unit 1001
- 1227 Brinson Ct
- 19442 Bold River Rd
- 1231 Heath Hollow Dr
- 20314 Dark Hollow Ln
- 11315 Granite Rock Ln
- 11307 Flying Geese Ln
- 9923 Eden Valley Dr
- 19211 Side Way
- 19718 Oxalis Ct
- 9619 Brackenton Crest Dr
- 1647 Grable Cove Ln
- 1643 Grable Cove Ln
- 1649 Grable Cove Ln
- 1641 Grable Cove Ln
- 1651 Grable Cove Ln
- 1639 Grable Cove Ln
- 1653 Grable Cove Ln
- 1637 Grable Cove Ln
- 1636 Grable Cove Ln
- 1635 Grable Cove Ln
- 1633 Grable Cove Ln
- 1640 Grable Cove Ln
- 1644 Grable Cove Ln
- 1638 Grable Cove Ln
- 1646 Grable Cove Ln
- 1631 Grable Cove Ln
- 1648 Grable Cove Ln
- 1650 Grable Cove Ln
- 1634 Grable Cove Ln
- 1629 Grable Cove Ln