M
Seller's Agent in 2017
MORRIS JENKINS
MALONE REALTY
Estimated Value: $131,000 - $170,000
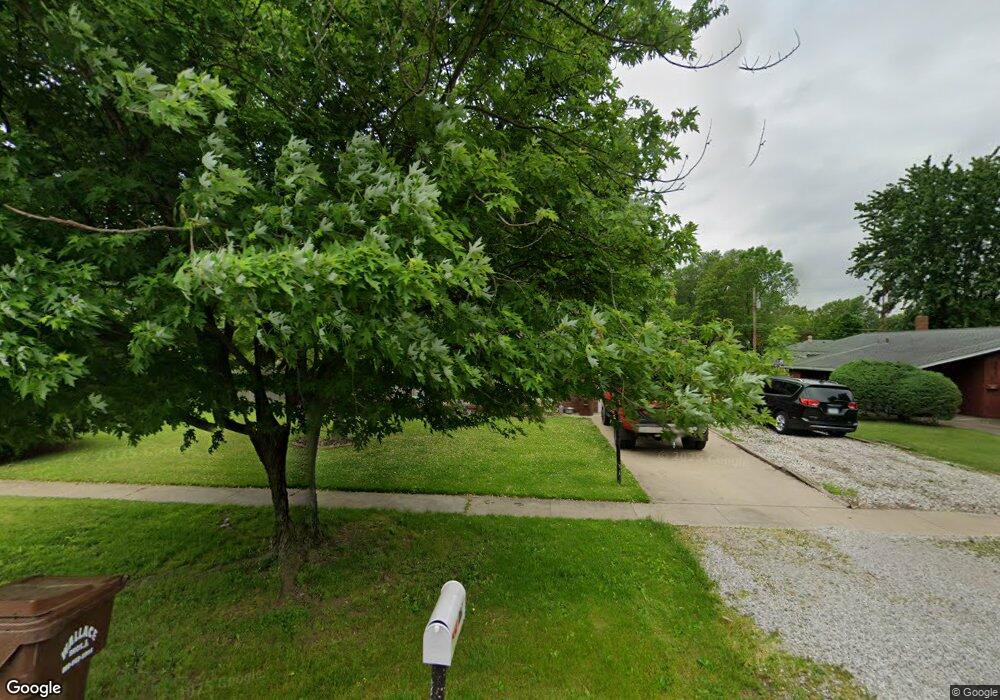
Immaculate brick ranch home with 3 bedrooms and 1 bath. 1 car attached garage. Natural gas heat, central air. Property included with sale 10 x 15 storage shed, 3 ceiling fans, refrig., DW, gas range, and GDO. Owner is relocating. SHOWN BY APPOINTMENT ONLY call listing office 765-832-7766 or Morris @ 812-243-3157. Nice open patio in rear, covered front porch and covered rear stoop. Must see, make your appointment today!
Last Agent to Sell the Property
MORRIS JENKINS
MALONE REALTY License #RB14012543 Listed on: 05/04/2017
Last Buyer's Agent
HOUSE *
NON MLS MEMBER
| Date | Buyer | Sale Price | Title Company |
|---|---|---|---|
| Hammond Brandon | -- | -- | |
| Fischer Justin | $75,000 | Abstract & Title Of Parke Co | |
| Fischer Justin | $75,000 | Abstract & Title Of Parke Co. | |
| Justin Fischer | $75,000 | Abstract & Title Of Parke Co. | |
| Fischer Justin | $75,000 | -- | |
| Not Provided | $75,000 | -- | |
| Sykes Dickie J | $59,900 | Antonini & Antonini | |
| Dickie J Sykes | $59,900 | Antonini & Antonini |
| Date | Event | Price | List to Sale | Price per Sq Ft |
|---|---|---|---|---|
| 06/17/2017 06/17/17 | Sold | $86,500 | +1.9% | $81 / Sq Ft |
| 05/17/2017 05/17/17 | Pending | -- | -- | -- |
| 05/04/2017 05/04/17 | For Sale | $84,900 | -- | $79 / Sq Ft |
| Year | Tax Paid | Tax Assessment Tax Assessment Total Assessment is a certain percentage of the fair market value that is determined by local assessors to be the total taxable value of land and additions on the property. | Land | Improvement |
|---|---|---|---|---|
| 2024 | $1,301 | $130,100 | $22,700 | $107,400 |
| 2023 | $1,309 | $130,900 | $22,700 | $108,200 |
| 2022 | $1,667 | $132,300 | $22,700 | $109,600 |
| 2021 | $1,543 | $122,300 | $22,700 | $99,600 |
| 2020 | $1,019 | $102,600 | $22,500 | $80,100 |
| 2019 | $816 | $82,200 | $12,500 | $69,700 |
| 2018 | $828 | $81,600 | $12,500 | $69,100 |
| 2017 | $798 | $81,000 | $12,500 | $68,500 |
| 2016 | $861 | $83,600 | $12,500 | $71,100 |
| 2014 | $886 | $86,600 | $12,500 | $74,100 |
| 2013 | $886 | $86,700 | $12,500 | $74,200 |
M
Seller's Agent in 2017
MORRIS JENKINS
MALONE REALTY
H
Buyer's Agent in 2017
HOUSE *
NON MLS MEMBER
Source: Terre Haute Area Association of REALTORS®
MLS Number: 82935
APN: 83-13-22-310-026.000-002