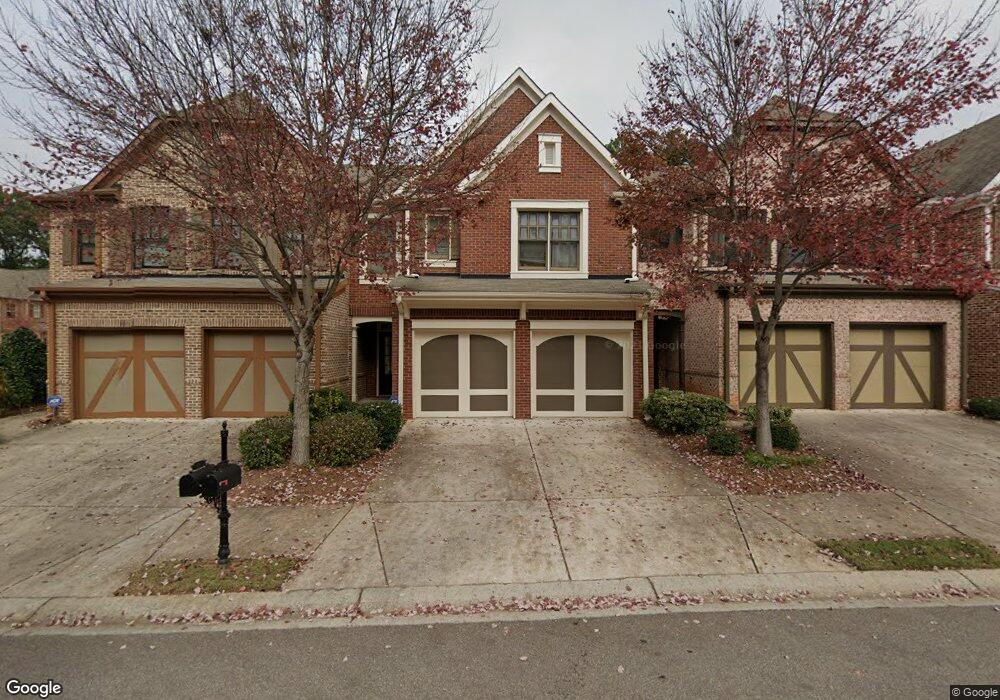
1645 Winshire Cove Unit 116 Alpharetta, GA 30004
Estimated Value: $449,838 - $473,000
3
Beds
3
Baths
1,856
Sq Ft
$250/Sq Ft
Est. Value
About This Home
This home is located at 1645 Winshire Cove Unit 116, Alpharetta, GA 30004 and is currently estimated at $464,210, approximately $250 per square foot. 1645 Winshire Cove Unit 116 is a home located in Forsyth County with nearby schools including Brandywine Elementary School, DeSana Middle School, and Denmark High School.
Ownership History
Date
Name
Owned For
Owner Type
Purchase Details
Closed on
Jan 9, 2024
Sold by
Kumar Babu Praveen
Bought by
Praveen Divya Trust and Kumar
Current Estimated Value
Purchase Details
Closed on
May 18, 2015
Sold by
Yon James Edwin
Bought by
Kumar Babu Praveen
Home Financials for this Owner
Home Financials are based on the most recent Mortgage that was taken out on this home.
Original Mortgage
$218,960
Interest Rate
3.62%
Mortgage Type
FHA
Purchase Details
Closed on
May 29, 2009
Sold by
Bowen Family Homes Inc
Bought by
Vonjames E
Home Financials for this Owner
Home Financials are based on the most recent Mortgage that was taken out on this home.
Original Mortgage
$196,377
Interest Rate
4.77%
Mortgage Type
FHA
Create a Home Valuation Report for This Property
The Home Valuation Report is an in-depth analysis detailing your home's value as well as a comparison with similar homes in the area
Home Values in the Area
Average Home Value in this Area
Purchase History
| Date | Buyer | Sale Price | Title Company |
|---|---|---|---|
| Praveen Divya Trust | -- | None Listed On Document | |
| Kumar Babu Praveen | $223,000 | -- | |
| Vonjames E | $200,000 | -- |
Source: Public Records
Mortgage History
| Date | Status | Borrower | Loan Amount |
|---|---|---|---|
| Previous Owner | Kumar Babu Praveen | $218,960 | |
| Previous Owner | Vonjames E | $196,377 |
Source: Public Records
Tax History Compared to Growth
Tax History
| Year | Tax Paid | Tax Assessment Tax Assessment Total Assessment is a certain percentage of the fair market value that is determined by local assessors to be the total taxable value of land and additions on the property. | Land | Improvement |
|---|---|---|---|---|
| 2025 | $3,481 | $182,408 | $78,000 | $104,408 |
| 2024 | $3,481 | $173,376 | $66,000 | $107,376 |
| 2023 | $2,893 | $159,980 | $56,000 | $103,980 |
| 2022 | $2,903 | $108,896 | $40,000 | $68,896 |
| 2021 | $2,715 | $108,896 | $40,000 | $68,896 |
| 2020 | $2,704 | $108,388 | $40,000 | $68,388 |
| 2019 | $2,630 | $104,600 | $40,000 | $64,600 |
| 2018 | $2,568 | $101,092 | $32,000 | $69,092 |
| 2017 | $2,314 | $88,600 | $32,000 | $56,600 |
| 2016 | $2,131 | $79,960 | $26,000 | $53,960 |
| 2015 | $2,221 | $79,896 | $26,000 | $53,896 |
| 2014 | -- | $67,308 | $20,000 | $47,308 |
Source: Public Records
Map
Nearby Homes
- 1570 Winshire Cove
- 1425 Faircrest Ln
- 1255 Faircrest Crossing Dr
- 1345 Faircrest Ln
- 1293 Dalesford Dr
- 1245 Overland Crossing
- 1405 Overland Crossing
- 1620 Woodall View Ct
- 1615 Waverly Glen Dr
- 6425 Halcyon Way
- 6460 Cortland Walk
- 6370 Cortland Walk
- 6645 Cortland Walk
- 1550 Township Cir
- 6785 Pippin Walk
- 6710 Pippin Walk
- 6835 Victory Run
- 1645 Winshire Cove
- 1655 Winshire Cove
- 1655 Winshire Cove
- 1655 Winshire Cove Unit 117
- 1635 Winshire Cove
- 1635 Winshire Cove Unit 115
- 1665 Winshire Cove
- 1665 Winshire Cove Unit 118
- 1525 Winshire Cove
- 1525 Winshire Cove Unit 114
- 1675 Winshire Cove
- 1675 Winshire Cove Unit 119
- 1685/ Winshire Cove
- 1515 Winshire Cove
- 1515 Winshire Cove Unit 113
- 1640 Winshire Cove
- 1685 Winshire Cove Unit 120
- 1685 Winshire Cove
- 1630 Winshire Cove
- 1630 Winshire Cove Unit 62