Estimated Value: $188,000 - $199,000
3
Beds
1
Bath
1,202
Sq Ft
$161/Sq Ft
Est. Value
About This Home
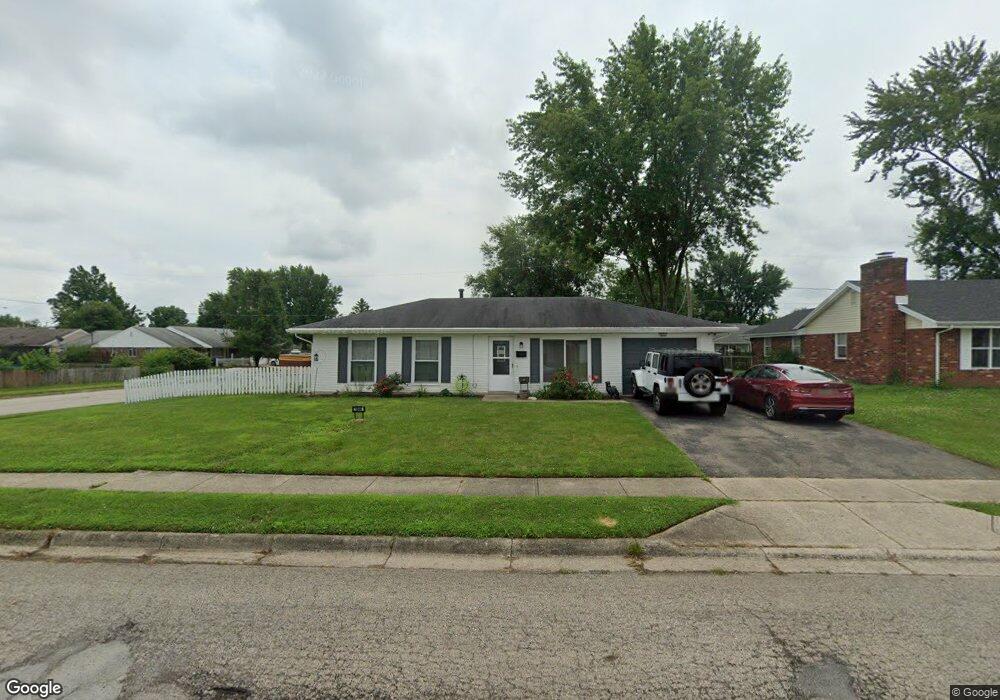
This home is located at 1646 Commonwealth Dr, Xenia, OH 45385 and is currently estimated at $193,623, approximately $161 per square foot. 1646 Commonwealth Dr is a home located in Greene County with nearby schools including Xenia High School, Summit Academy Community School for Alternative Learners - Xenia, and Legacy Christian Academy.
Ownership History
Date
Name
Owned For
Owner Type
Purchase Details
Closed on
Sep 8, 2017
Sold by
Clark John E and Clark Carolyn S
Bought by
Daye Angela and Curtis Raymond
Current Estimated Value
Home Financials for this Owner
Home Financials are based on the most recent Mortgage that was taken out on this home.
Original Mortgage
$96,126
Outstanding Balance
$81,264
Interest Rate
4.37%
Mortgage Type
FHA
Estimated Equity
$112,359
Purchase Details
Closed on
Sep 15, 2015
Sold by
Wilson Verl A and Wilson Shelly
Bought by
Clark John E and Clark Carolyn S
Purchase Details
Closed on
Jun 29, 1998
Sold by
Walker Aaron L and Walker Roxie Hunter
Bought by
Wilson Verl A and Wilson Mary E
Home Financials for this Owner
Home Financials are based on the most recent Mortgage that was taken out on this home.
Original Mortgage
$66,800
Interest Rate
7.18%
Create a Home Valuation Report for This Property
The Home Valuation Report is an in-depth analysis detailing your home's value as well as a comparison with similar homes in the area
Home Values in the Area
Average Home Value in this Area
Purchase History
| Date | Buyer | Sale Price | Title Company |
|---|---|---|---|
| Daye Angela | $97,900 | None Available | |
| Clark John E | $45,000 | Attorney | |
| Wilson Verl A | $71,500 | -- |
Source: Public Records
Mortgage History
| Date | Status | Borrower | Loan Amount |
|---|---|---|---|
| Open | Daye Angela | $96,126 | |
| Previous Owner | Wilson Verl A | $66,800 |
Source: Public Records
Tax History
| Year | Tax Paid | Tax Assessment Tax Assessment Total Assessment is a certain percentage of the fair market value that is determined by local assessors to be the total taxable value of land and additions on the property. | Land | Improvement |
|---|---|---|---|---|
| 2024 | $2,098 | $48,170 | $12,110 | $36,060 |
| 2023 | $2,061 | $48,170 | $12,110 | $36,060 |
| 2022 | $1,708 | $34,040 | $7,130 | $26,910 |
| 2021 | $1,731 | $34,040 | $7,130 | $26,910 |
| 2020 | $1,658 | $34,040 | $7,130 | $26,910 |
| 2019 | $1,434 | $27,720 | $7,010 | $20,710 |
| 2018 | $1,440 | $27,720 | $7,010 | $20,710 |
| 2017 | $1,361 | $27,720 | $7,010 | $20,710 |
| 2016 | $1,287 | $24,980 | $7,010 | $17,970 |
| 2015 | -- | $24,980 | $7,010 | $17,970 |
| 2014 | $1,270 | $24,980 | $7,010 | $17,970 |
Source: Public Records
Map
Nearby Homes
- 1480 Texas Dr
- 1778 Arapaho Dr
- 1772 Maumee Dr
- 1255 Colorado Dr
- 2149 Cornwall Dr
- 1272 Bellbrook Ave
- 2499 Jenny Marie Dr
- 1874 Pennsylvania Dr
- 1321 Massachusetts Dr
- 624 Georgia Dr
- 1362 Arrowhead Trail
- 414 Whisper Ln
- 0 Berkshire Dr Unit 949217
- 1010 Bellbrook Ave
- 161 Montana Dr
- 1100 Spegele Ct
- 310 Tranquil Dr
- 219 Kansas Dr
- 1001 Glen Kegley Dr
- 1980 Kitty Hawk Dr
- 1632 Commonwealth Dr
- 1738 Atkinson Dr
- 1670 Commonwealth Dr
- 1677 Roxbury Dr
- 1618 Commonwealth Dr
- 1621 Commonwealth Dr
- 1607 Commonwealth Dr
- 1665 Roxbury Dr
- 1593 Commonwealth Dr
- 1604 Commonwealth Dr
- 1684 Commonwealth Dr
- 1645 Commonwealth Dr
- 1651 Roxbury Dr
- 1706 Roxbury Dr
- 1347 Texas Dr
- 1361 Texas Dr
- 1659 Commonwealth Dr
- 1590 Commonwealth Dr
- 1700 Commonwealth Dr
- 1771 Atkinson Dr