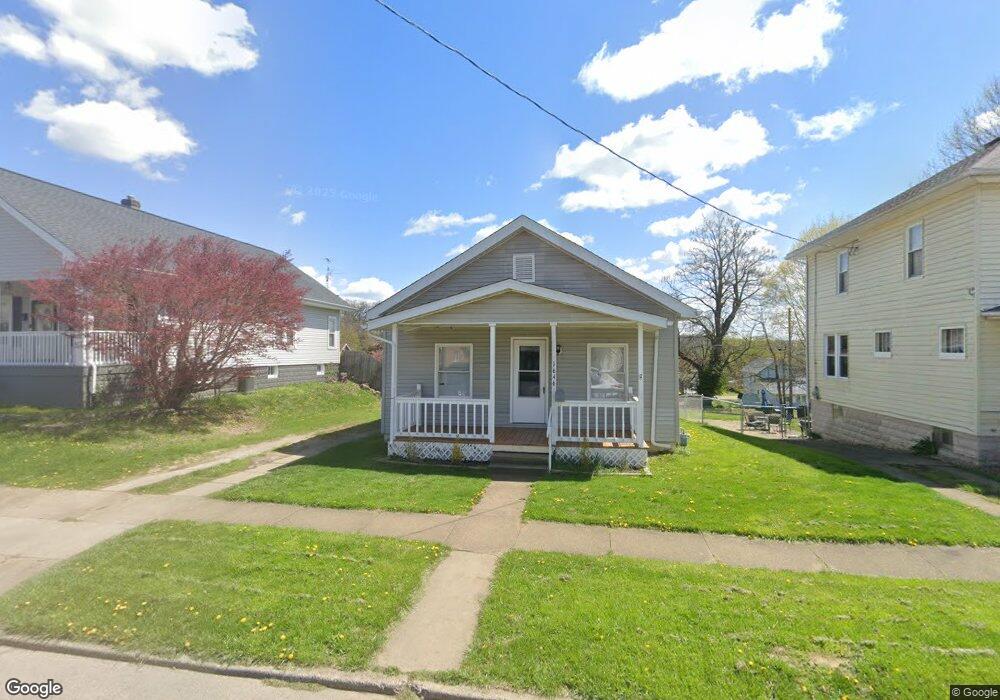
1646 Euclid Ave Zanesville, OH 43701
Estimated Value: $89,000 - $161,000
2
Beds
1
Bath
960
Sq Ft
$128/Sq Ft
Est. Value
About This Home
This home is located at 1646 Euclid Ave, Zanesville, OH 43701 and is currently estimated at $122,476, approximately $127 per square foot. 1646 Euclid Ave is a home located in Muskingum County with nearby schools including John McIntire Elementary School, Zanesville Middle School, and Zanesville High School.
Ownership History
Date
Name
Owned For
Owner Type
Purchase Details
Closed on
Mar 9, 2011
Sold by
Springleaf Financial Services Of Ohio In
Bought by
Hoffer James R and Hoffer Carol S
Current Estimated Value
Purchase Details
Closed on
Nov 22, 2010
Sold by
Seevers William E
Bought by
American General Financial Services Inc
Purchase Details
Closed on
Oct 5, 1999
Sold by
Fisher Gregory A
Bought by
Seevers William E and Seevers Sondra L
Home Financials for this Owner
Home Financials are based on the most recent Mortgage that was taken out on this home.
Original Mortgage
$55,000
Interest Rate
7.93%
Mortgage Type
Balloon
Purchase Details
Closed on
Aug 28, 1996
Sold by
Fuller Kathryn Ann
Bought by
Fisher Gregory A
Home Financials for this Owner
Home Financials are based on the most recent Mortgage that was taken out on this home.
Original Mortgage
$45,399
Interest Rate
8.3%
Mortgage Type
FHA
Create a Home Valuation Report for This Property
The Home Valuation Report is an in-depth analysis detailing your home's value as well as a comparison with similar homes in the area
Home Values in the Area
Average Home Value in this Area
Purchase History
| Date | Buyer | Sale Price | Title Company |
|---|---|---|---|
| Hoffer James R | $18,000 | None Available | |
| Hoffer James R | $18,000 | Attorney | |
| American General Financial Services Inc | $20,000 | Attorney | |
| Seevers William E | $55,000 | -- | |
| Fisher Gregory A | $44,900 | -- |
Source: Public Records
Mortgage History
| Date | Status | Borrower | Loan Amount |
|---|---|---|---|
| Previous Owner | Seevers William E | $55,000 | |
| Previous Owner | Fisher Gregory A | $45,399 |
Source: Public Records
Tax History Compared to Growth
Tax History
| Year | Tax Paid | Tax Assessment Tax Assessment Total Assessment is a certain percentage of the fair market value that is determined by local assessors to be the total taxable value of land and additions on the property. | Land | Improvement |
|---|---|---|---|---|
| 2024 | $591 | $15,820 | $6,510 | $9,310 |
| 2023 | $498 | $12,460 | $5,005 | $7,455 |
| 2022 | $517 | $12,460 | $5,005 | $7,455 |
| 2021 | $488 | $12,460 | $5,005 | $7,455 |
| 2020 | $418 | $10,395 | $4,165 | $6,230 |
| 2019 | $418 | $10,395 | $4,165 | $6,230 |
| 2018 | $480 | $10,395 | $4,165 | $6,230 |
| 2017 | $526 | $12,425 | $4,165 | $8,260 |
| 2016 | $534 | $12,430 | $4,170 | $8,260 |
| 2015 | $535 | $12,430 | $4,170 | $8,260 |
| 2013 | $597 | $12,430 | $4,170 | $8,260 |
Source: Public Records
Map
Nearby Homes
- 513 Van Horn Ave
- 1430 Euclid Ave
- 626 Saint Louis Ave
- 1435 Bluff St
- 357 Mcconnell Ave
- 641 Fairmont Ave
- 1968 Dresden Rd
- 714 Saint Louis Ave
- 370 Sheridan St
- 1643 Linden Ave
- 1516 Myrtle Ave
- 720 Locust Ave
- 1417 Central Ave
- 453 Yale Ave
- 839 Brown St
- 1264 Linden Ave
- 1926 Norwood Blvd
- 1630 Marion Ave
- 1119 Abbey Place
- 435 Westview Dr
- 1654 Euclid Ave
- 1640 Euclid Ave
- 1660 Euclid Ave
- 1636 Euclid Ave
- 1630 Euclid Ave
- 1641 Spruce St
- 1657 Spruce St
- 1631 Spruce St
- 1647 Spruce St
- 1645 Euclid Ave
- 1651 Euclid Ave
- 1622 Euclid Ave
- 1641 Euclid Ave
- 1627 Spruce St
- 1657 Euclid Ave
- 1635 Euclid Ave
- 1720 Euclid Ave
- 1621 Spruce St
- 1625 Euclid Ave
- 489 Mcconnell Ave