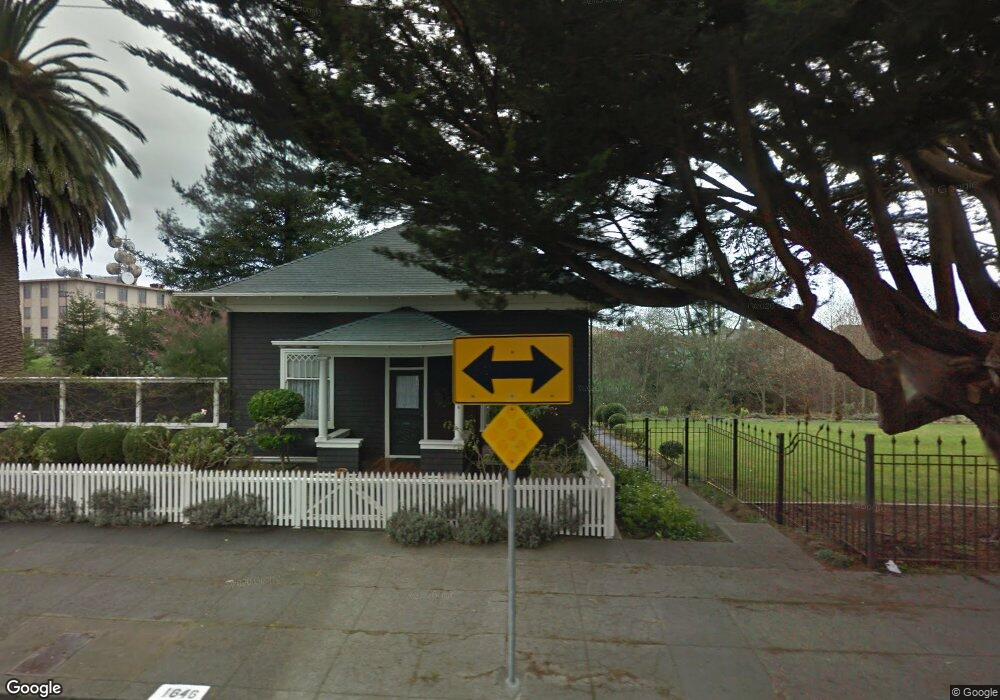
1646 G St Eureka, CA 95501
Broadway Street NeighborhoodEstimated Value: $570,000 - $729,000
5
Beds
2
Baths
4,811
Sq Ft
$135/Sq Ft
Est. Value
About This Home
This home is located at 1646 G St, Eureka, CA 95501 and is currently estimated at $651,622, approximately $135 per square foot. 1646 G St is a home located in Humboldt County with nearby schools including Lafayette Elementary School, Catherine L. Zane Middle School, and Eureka Senior High School.
Ownership History
Date
Name
Owned For
Owner Type
Purchase Details
Closed on
Dec 3, 2019
Sold by
Kuhnel Ronald William
Bought by
Kuhnel Ronald William
Current Estimated Value
Purchase Details
Closed on
May 13, 2013
Sold by
Kuhnel Ronald W
Bought by
Kuhnel Ronald Williams and Kuhnel Melanie Anne
Purchase Details
Closed on
Feb 23, 2009
Sold by
Kuhnel Betty Louise
Bought by
Kuhnel Ronald W
Purchase Details
Closed on
Jan 5, 1998
Sold by
Louise Pierson
Bought by
Pierson Henry E
Purchase Details
Closed on
Dec 23, 1997
Sold by
Louise Pierson
Bought by
Pierson Henry E
Create a Home Valuation Report for This Property
The Home Valuation Report is an in-depth analysis detailing your home's value as well as a comparison with similar homes in the area
Home Values in the Area
Average Home Value in this Area
Purchase History
| Date | Buyer | Sale Price | Title Company |
|---|---|---|---|
| Kuhnel Ronald William | -- | None Available | |
| Kuhnel Ronald Williams | -- | None Available | |
| Kuhnel Ronald W | -- | None Available | |
| Pierson Henry E | -- | -- | |
| Pierson Henry E | -- | -- |
Source: Public Records
Tax History
| Year | Tax Paid | Tax Assessment Tax Assessment Total Assessment is a certain percentage of the fair market value that is determined by local assessors to be the total taxable value of land and additions on the property. | Land | Improvement |
|---|---|---|---|---|
| 2025 | $6,085 | $591,642 | $366,879 | $224,763 |
| 2024 | $6,085 | $580,042 | $359,686 | $220,356 |
| 2023 | $5,999 | $568,670 | $352,634 | $216,036 |
| 2022 | $6,227 | $557,520 | $345,720 | $211,800 |
| 2021 | $5,832 | $546,590 | $338,942 | $207,648 |
| 2020 | $5,789 | $540,986 | $335,467 | $205,519 |
| 2019 | $5,670 | $530,380 | $328,890 | $201,490 |
| 2018 | $5,585 | $519,982 | $322,442 | $197,540 |
| 2017 | $5,557 | $509,787 | $316,120 | $193,667 |
| 2016 | $5,558 | $499,792 | $309,922 | $189,870 |
| 2015 | $5,509 | $492,285 | $305,267 | $187,018 |
| 2014 | $5,150 | $482,643 | $299,288 | $183,355 |
Source: Public Records
Map
Nearby Homes
Your Personal Tour Guide
Ask me questions while you tour the home.