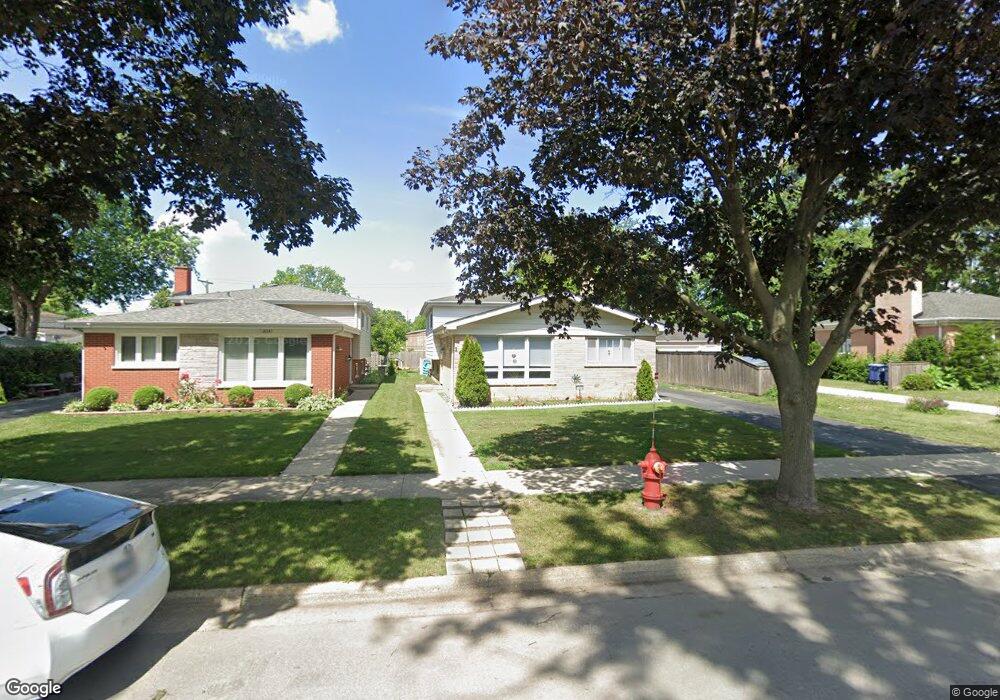
1646 Illinois St Des Plaines, IL 60018
Estimated Value: $343,000 - $416,000
3
Beds
2
Baths
1,275
Sq Ft
$298/Sq Ft
Est. Value
About This Home
This home is located at 1646 Illinois St, Des Plaines, IL 60018 and is currently estimated at $379,414, approximately $297 per square foot. 1646 Illinois St is a home located in Cook County with nearby schools including South Elementary School, Algonquin Middle School, and Maine West High School.
Ownership History
Date
Name
Owned For
Owner Type
Purchase Details
Closed on
Aug 26, 2024
Sold by
Drapinski Frank J
Bought by
Cohan Antonette T
Current Estimated Value
Home Financials for this Owner
Home Financials are based on the most recent Mortgage that was taken out on this home.
Original Mortgage
$346,750
Outstanding Balance
$341,795
Interest Rate
6.78%
Mortgage Type
New Conventional
Estimated Equity
$37,619
Purchase Details
Closed on
Jul 17, 2018
Sold by
Whitney Larry A and Duong Kimberly
Bought by
Drapinski Frank J
Home Financials for this Owner
Home Financials are based on the most recent Mortgage that was taken out on this home.
Original Mortgage
$208,000
Interest Rate
4.75%
Mortgage Type
New Conventional
Purchase Details
Closed on
Aug 30, 1993
Sold by
Myszkowski Bruno J and Myszkowski Stella M
Bought by
Whitney Larry A
Create a Home Valuation Report for This Property
The Home Valuation Report is an in-depth analysis detailing your home's value as well as a comparison with similar homes in the area
Home Values in the Area
Average Home Value in this Area
Purchase History
| Date | Buyer | Sale Price | Title Company |
|---|---|---|---|
| Cohan Antonette T | $359,000 | Chicago Title | |
| Drapinski Frank J | $260,000 | Chicago Title Company | |
| Whitney Larry A | -- | -- |
Source: Public Records
Mortgage History
| Date | Status | Borrower | Loan Amount |
|---|---|---|---|
| Open | Cohan Antonette T | $346,750 | |
| Previous Owner | Drapinski Frank J | $208,000 |
Source: Public Records
Tax History
| Year | Tax Paid | Tax Assessment Tax Assessment Total Assessment is a certain percentage of the fair market value that is determined by local assessors to be the total taxable value of land and additions on the property. | Land | Improvement |
|---|---|---|---|---|
| 2025 | $3,702 | $18,368 | $2,813 | $15,555 |
| 2024 | $3,702 | $14,041 | $2,344 | $11,697 |
| 2023 | $3,613 | $14,041 | $2,344 | $11,697 |
| 2022 | $3,613 | $14,041 | $2,344 | $11,697 |
| 2021 | $2,845 | $9,256 | $1,953 | $7,303 |
| 2020 | $2,797 | $9,256 | $1,953 | $7,303 |
| 2019 | $2,799 | $10,400 | $1,953 | $8,447 |
| 2018 | $3,548 | $11,863 | $1,718 | $10,145 |
| 2017 | $3,485 | $11,863 | $1,718 | $10,145 |
| 2016 | $3,296 | $11,863 | $1,718 | $10,145 |
| 2015 | $3,149 | $10,415 | $1,484 | $8,931 |
| 2014 | $3,082 | $10,415 | $1,484 | $8,931 |
| 2013 | $3,006 | $10,415 | $1,484 | $8,931 |
Source: Public Records
Map
Nearby Homes
- 1645 Illinois St
- 1689 S Elm St
- 1696 S Elm St
- 1445 Everett Ave
- 1509 Center St
- 1721 Prospect Ave
- 1700 E Forest Ave
- 1640 S River Rd
- 1080 Bogart St
- 1370 Fargo Ave Unit E
- 1990 Berry Ln
- 1922 Fargo Ave
- 1630 Henry Ave
- 815 E Oakton St Unit 311
- 1458 Kingston Ct
- 1394 Carol Ln
- 1524 Oakwood Ave
- 1380 Oakwood Ave Unit 306
- 1629 E Touhy Ave
- 1638 Oakwood Ave
- 1646 Illinois St
- 1636 Illinois St
- 1636 Illinois St
- 1654 Illinois St
- 1654 Illinois St
- 1666 Illinois St
- 1635 S Elm St
- 1635 S Elm St
- 1649 S Elm St
- 1649 S Elm St
- 1657 S Elm St
- 1657 S Elm St
- 1633 S Elm St
- 1674 Illinois St
- 1665 S Elm St
- 1653 Illinois St
- 1653 Illinois St
- 1475 E Oakton St
- 1637 Illinois St
- 1661 Illinois St
Your Personal Tour Guide
Ask me questions while you tour the home.