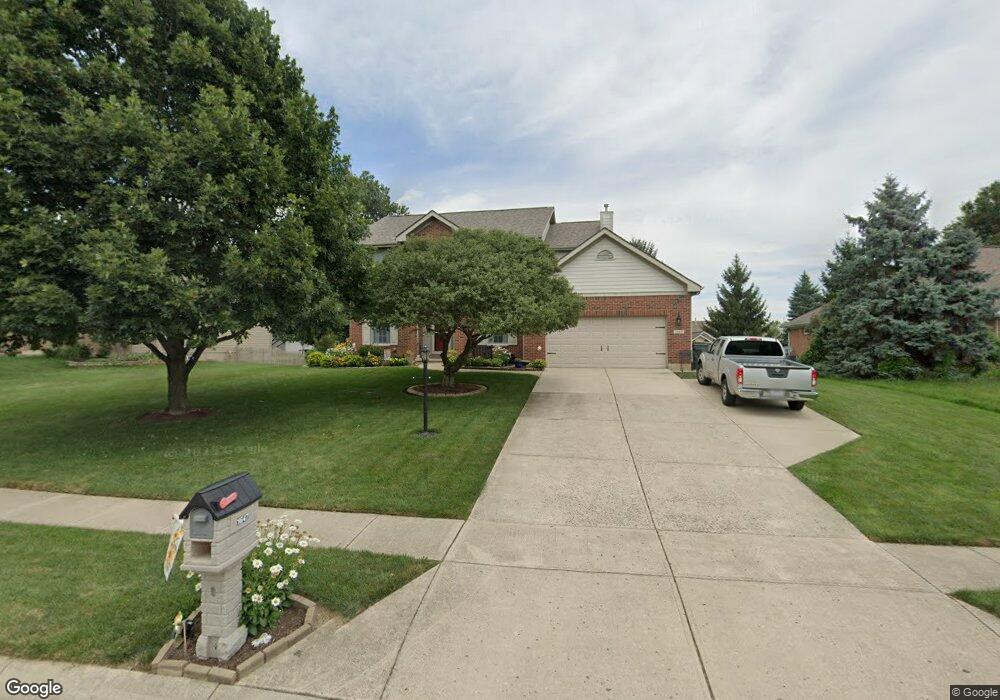
1647 Lago Mar Dayton, OH 45458
Estimated Value: $518,032 - $585,000
4
Beds
4
Baths
2,594
Sq Ft
$215/Sq Ft
Est. Value
About This Home
This home is located at 1647 Lago Mar, Dayton, OH 45458 and is currently estimated at $557,508, approximately $214 per square foot. 1647 Lago Mar is a home located in Montgomery County with nearby schools including Primary Village South, Normandy Elementary School, and Hadley E Watts Middle School.
Ownership History
Date
Name
Owned For
Owner Type
Purchase Details
Closed on
Jun 2, 2021
Sold by
Molnar Lon William and Molnar Therese Lynn
Bought by
Molnar Nathaniel and The Molnar Irrevocable Heritag
Current Estimated Value
Purchase Details
Closed on
Apr 13, 2017
Sold by
Worrell Barry C and Worrell Debra S
Bought by
Molnar Lon William and Molnar Therese Lynn
Home Financials for this Owner
Home Financials are based on the most recent Mortgage that was taken out on this home.
Original Mortgage
$239,900
Outstanding Balance
$193,389
Interest Rate
3.12%
Mortgage Type
Adjustable Rate Mortgage/ARM
Estimated Equity
$364,119
Purchase Details
Closed on
Feb 15, 2000
Sold by
Swango Brainard Homes
Bought by
Worrell Barry C and Worrell Debra S
Home Financials for this Owner
Home Financials are based on the most recent Mortgage that was taken out on this home.
Original Mortgage
$90,000
Interest Rate
8.21%
Create a Home Valuation Report for This Property
The Home Valuation Report is an in-depth analysis detailing your home's value as well as a comparison with similar homes in the area
Home Values in the Area
Average Home Value in this Area
Purchase History
| Date | Buyer | Sale Price | Title Company |
|---|---|---|---|
| Molnar Nathaniel | -- | None Available | |
| Molnar Lona William | -- | None Available | |
| Molnar Lon William | $324,900 | Home Services Title Llc | |
| Worrell Barry C | $252,300 | -- |
Source: Public Records
Mortgage History
| Date | Status | Borrower | Loan Amount |
|---|---|---|---|
| Open | Molnar Lon William | $239,900 | |
| Previous Owner | Worrell Barry C | $90,000 |
Source: Public Records
Tax History Compared to Growth
Tax History
| Year | Tax Paid | Tax Assessment Tax Assessment Total Assessment is a certain percentage of the fair market value that is determined by local assessors to be the total taxable value of land and additions on the property. | Land | Improvement |
|---|---|---|---|---|
| 2024 | $9,210 | $149,600 | $29,820 | $119,780 |
| 2023 | $9,210 | $149,600 | $29,820 | $119,780 |
| 2022 | $8,199 | $105,350 | $21,000 | $84,350 |
| 2021 | $8,827 | $113,120 | $21,000 | $92,120 |
| 2020 | $8,814 | $113,120 | $21,000 | $92,120 |
| 2019 | $8,097 | $92,840 | $21,000 | $71,840 |
| 2018 | $7,231 | $92,840 | $21,000 | $71,840 |
| 2017 | $7,154 | $92,840 | $21,000 | $71,840 |
| 2016 | $7,245 | $88,630 | $21,000 | $67,630 |
| 2015 | $7,128 | $88,630 | $21,000 | $67,630 |
| 2014 | $7,128 | $88,630 | $21,000 | $67,630 |
| 2012 | -- | $86,390 | $21,000 | $65,390 |
Source: Public Records
Map
Nearby Homes
- 9372 Parkside Dr
- 9475 Copperton Dr
- 1565 Silverlake Dr
- 9519 Tahoe Dr
- 9515 Tahoe Dr
- 9251 Great Lakes Cir Unit 59251
- 9540 Tahoe Dr
- 9553 Tahoe Dr
- 1591 Watermark Ct Unit 241591
- 1794 Placid Dr
- 1573 Watermark Ct Unit 221573
- 9588 Tahoe Dr
- 9604 Tahoe Dr
- 9406 Tahoe Dr Unit 19406
- 9607 Olde Georgetown
- 1800 Olde Haley Dr
- 9747 Cobblewood Ct
- 9471 Banyan Ct
- 9460 Banyan Ct
- 1739 Waterstone Blvd Unit 208
- 1637 Lago Mar
- 1657 Lago Mar
- 9389 Parkside Dr
- 9397 Parkside Dr
- 1665 Lago Mar
- 1627 Lago Mar
- 9381 Parkside Dr
- 1650 Lago Mar
- 1642 Lago Mar
- 9405 Parkside Dr
- 1658 Lago Mar
- 1634 Lago Mar
- 9415 Parkside Dr
- 1675 Lago Mar
- 9425 Parkside Dr
- 1626 Lago Mar
- 1637 Sunnington Grove Dr
- 9373 Parkside Dr
- 1668 Lago Mar
- 9470 Copperton Dr