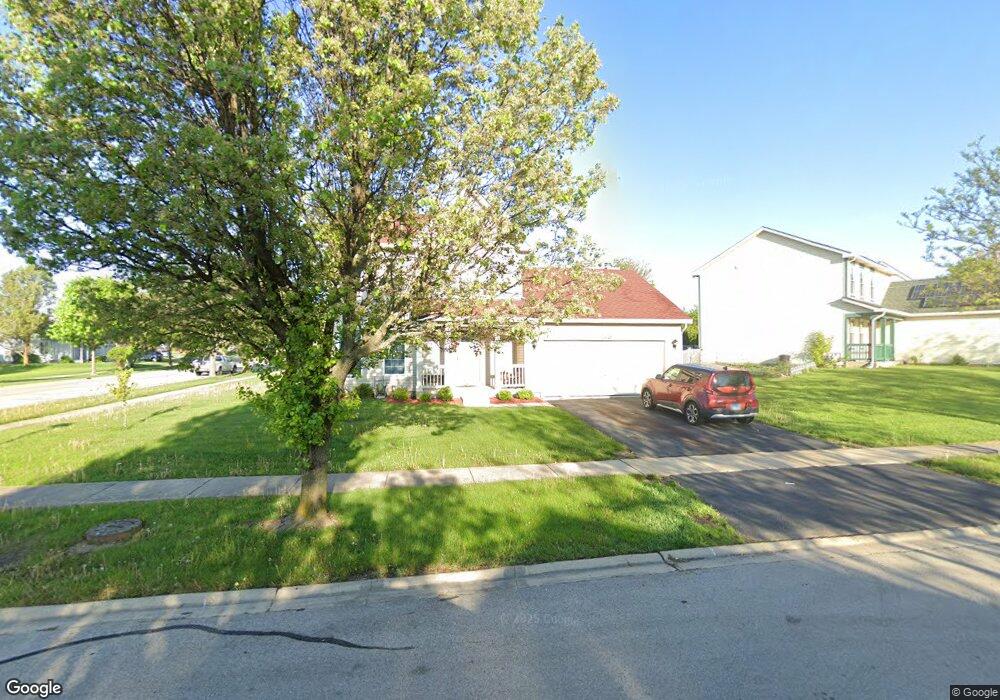
1647 Peter Ln Unit 7 Romeoville, IL 60446
Lakewood Falls NeighborhoodEstimated Value: $337,688 - $381,000
--
Bed
1
Bath
1,579
Sq Ft
$225/Sq Ft
Est. Value
About This Home
This home is located at 1647 Peter Ln Unit 7, Romeoville, IL 60446 and is currently estimated at $354,672, approximately $224 per square foot. 1647 Peter Ln Unit 7 is a home located in Will County with nearby schools including Lakewood Falls Elementary School, Heritage Grove Middle School, and Plainfield East High School.
Ownership History
Date
Name
Owned For
Owner Type
Purchase Details
Closed on
Nov 29, 2006
Sold by
Ferolino Levy B and Arza Novelyn A
Bought by
Ferolino Levy B
Current Estimated Value
Home Financials for this Owner
Home Financials are based on the most recent Mortgage that was taken out on this home.
Original Mortgage
$233,700
Outstanding Balance
$148,706
Interest Rate
7.5%
Mortgage Type
Purchase Money Mortgage
Estimated Equity
$205,966
Purchase Details
Closed on
Aug 27, 2003
Sold by
Ferolino Levy
Bought by
Ferolino Levy and Arzaga Novelyn A
Purchase Details
Closed on
May 30, 2002
Sold by
Lakewood Falls Phase 7 Llc
Bought by
Ferolino Levy B
Home Financials for this Owner
Home Financials are based on the most recent Mortgage that was taken out on this home.
Original Mortgage
$184,429
Interest Rate
7%
Mortgage Type
FHA
Create a Home Valuation Report for This Property
The Home Valuation Report is an in-depth analysis detailing your home's value as well as a comparison with similar homes in the area
Home Values in the Area
Average Home Value in this Area
Purchase History
| Date | Buyer | Sale Price | Title Company |
|---|---|---|---|
| Ferolino Levy B | -- | Ticor Title Ins Co 2002 | |
| Ferolino Levy | -- | -- | |
| Ferolino Levy B | $187,500 | Chicago Title Insurance Co |
Source: Public Records
Mortgage History
| Date | Status | Borrower | Loan Amount |
|---|---|---|---|
| Open | Ferolino Levy B | $233,700 | |
| Closed | Ferolino Levy B | $184,429 |
Source: Public Records
Tax History Compared to Growth
Tax History
| Year | Tax Paid | Tax Assessment Tax Assessment Total Assessment is a certain percentage of the fair market value that is determined by local assessors to be the total taxable value of land and additions on the property. | Land | Improvement |
|---|---|---|---|---|
| 2024 | $8,359 | $107,947 | $24,742 | $83,205 |
| 2023 | $8,359 | $96,909 | $22,212 | $74,697 |
| 2022 | $7,915 | $86,028 | $19,718 | $66,310 |
| 2021 | $6,932 | $80,846 | $18,530 | $62,316 |
| 2020 | $6,812 | $78,188 | $17,921 | $60,267 |
| 2019 | $6,477 | $74,112 | $16,987 | $57,125 |
| 2018 | $6,211 | $69,857 | $16,012 | $53,845 |
| 2017 | $5,789 | $64,026 | $14,676 | $49,350 |
| 2016 | $5,209 | $56,824 | $13,025 | $43,799 |
| 2015 | $4,304 | $50,530 | $11,582 | $38,948 |
| 2014 | $4,304 | $45,525 | $10,724 | $34,801 |
| 2013 | $4,304 | $50,584 | $11,916 | $38,668 |
Source: Public Records
Map
Nearby Homes
- 412 Rachel Cir Unit 7
- 1611 Benzie Cir Unit 1
- 249 Gladiolus Dr
- 669 Bridgeman Ln Unit 1
- 262 E Daisy Cir Unit 1
- 1794 N Wentworth Cir
- 251 Summerfield Dr
- 1517 W Ludington Cir Unit 3
- 1592 Cadillac Cir
- 1508 Ludington
- 1532 W Cadillac Cir
- 1594 Baytree Dr
- 1647 Rose Ln Unit 3
- 1973 W Crestview Cir
- 1565 Azalea Cir Unit 694
- 746 S Mecosta Ln
- 715 S Wellston Ln
- 1852 Sierra Trail
- 1986 W Brimstone Rd Unit 1
- 733 S Mecosta Ln Unit 2
- 1651 Peter Ln
- 1656 Richfield Trail
- 1655 Peter Ln Unit 7
- 1660 Richfield Trail
- 1648 Richfield Trail Unit 7
- 1659 Peter Ln Unit 7
- 1663 Richfield Trail Unit 7B
- 1640 Peter Ln
- 1664 Richfield Trail Unit 7
- 1663 Peter Ln Unit 7
- 1646 Peter Ln Unit 1
- 1644 Richfield Trail
- 1669 Richfield Trail Unit 7B
- 1650 Peter Ln
- 1667 Peter Ln Unit 7
- 1668 Richfield Trail Unit 7
- 1654 Peter Ln
- 1658 Peter Ln
- 1640 Richfield Trail
- 1662 Peter Ln