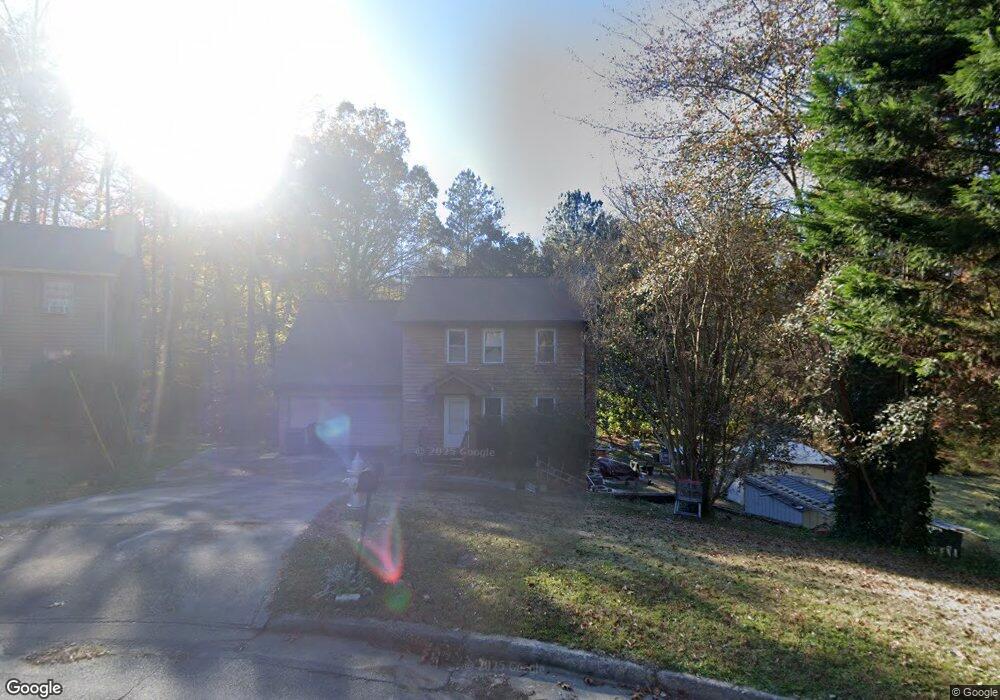
1647 Roman Point Dr Unit 3 Norcross, GA 30093
Estimated Value: $304,000 - $377,000
3
Beds
3
Baths
1,522
Sq Ft
$222/Sq Ft
Est. Value
About This Home
This home is located at 1647 Roman Point Dr Unit 3, Norcross, GA 30093 and is currently estimated at $337,635, approximately $221 per square foot. 1647 Roman Point Dr Unit 3 is a home located in Gwinnett County with nearby schools including Meadowcreek Elementary School, Louise Radloff Middle School, and Meadowcreek High School.
Ownership History
Date
Name
Owned For
Owner Type
Purchase Details
Closed on
Apr 12, 1999
Sold by
Hud
Bought by
Cabrera Ramon J
Current Estimated Value
Home Financials for this Owner
Home Financials are based on the most recent Mortgage that was taken out on this home.
Original Mortgage
$101,166
Outstanding Balance
$24,439
Interest Rate
6.98%
Mortgage Type
FHA
Estimated Equity
$313,196
Purchase Details
Closed on
Oct 6, 1998
Sold by
Gmac Corp
Bought by
Hud
Purchase Details
Closed on
Nov 21, 1997
Sold by
Pitek Kenneth J
Bought by
Garvin Anthony
Home Financials for this Owner
Home Financials are based on the most recent Mortgage that was taken out on this home.
Original Mortgage
$99,390
Interest Rate
7.38%
Mortgage Type
FHA
Purchase Details
Closed on
Jun 10, 1997
Sold by
Newson David M
Bought by
Pitck Kenneth J
Home Financials for this Owner
Home Financials are based on the most recent Mortgage that was taken out on this home.
Original Mortgage
$73,500
Interest Rate
8.01%
Mortgage Type
New Conventional
Create a Home Valuation Report for This Property
The Home Valuation Report is an in-depth analysis detailing your home's value as well as a comparison with similar homes in the area
Home Values in the Area
Average Home Value in this Area
Purchase History
| Date | Buyer | Sale Price | Title Company |
|---|---|---|---|
| Cabrera Ramon J | -- | -- | |
| Hud | -- | -- | |
| Gmac Mtg Corp | $104,602 | -- | |
| Garvin Anthony | $99,500 | -- | |
| Pitck Kenneth J | $98,000 | -- |
Source: Public Records
Mortgage History
| Date | Status | Borrower | Loan Amount |
|---|---|---|---|
| Open | Cabrera Ramon J | $101,166 | |
| Previous Owner | Garvin Anthony | $99,390 | |
| Previous Owner | Pitck Kenneth J | $73,500 |
Source: Public Records
Tax History Compared to Growth
Tax History
| Year | Tax Paid | Tax Assessment Tax Assessment Total Assessment is a certain percentage of the fair market value that is determined by local assessors to be the total taxable value of land and additions on the property. | Land | Improvement |
|---|---|---|---|---|
| 2025 | $3,287 | $130,800 | $21,120 | $109,680 |
| 2024 | $3,253 | $123,600 | $21,120 | $102,480 |
| 2023 | $3,253 | $111,760 | $23,200 | $88,560 |
| 2022 | $2,687 | $98,520 | $14,400 | $84,120 |
| 2021 | $2,142 | $70,920 | $14,400 | $56,520 |
| 2020 | $2,157 | $70,920 | $14,400 | $56,520 |
| 2019 | $1,890 | $60,600 | $11,200 | $49,400 |
| 2018 | $1,888 | $60,600 | $11,200 | $49,400 |
| 2016 | $1,611 | $46,800 | $8,800 | $38,000 |
| 2015 | $1,412 | $37,240 | $6,400 | $30,840 |
| 2014 | -- | $37,240 | $6,400 | $30,840 |
Source: Public Records
Map
Nearby Homes
- 1637 Roman Point Dr
- 5590 Stonewood Ct
- 1437 Roman Point Dr
- 1461 Silver Lake Dr
- 1353 Harbins Ridge Dr Unit 36
- 5341 Woodbin Dr
- 1413 Silver Lake Dr
- 5719 Singlebriar Ct
- 897 Six Oaks Cir Unit B
- 936 Six Oaks Cir Unit B
- 5665 Terremont Cir
- 5605 Rock Place Ct
- 5375 Goshen Springs Rd
- 1013 Sandune Dr
- 1665 Oakbrook Lake Dr
- 5554 Clover Rise Ln Unit 2
- 1133 Sandune Dr
- 1648 Roman Point Dr
- 5506 Estates Ct
- 1638 Roman Point Dr
- 5504 Estates Ct
- 1628 Roman Point Dr
- 5512 Estates Ct Unit B
- 5512 Estates Ct Unit 5512
- 5512 Estates Ct
- 5512 Estates Ct Unit 2
- 5512 Estates Ct Unit 1
- 1637 Roman Point Dr Unit D/24
- 1618 Roman Point Dr
- 5531 Roman Point Ct Unit 2
- 5524 Estates Ct
- 5524 Estates Ct Unit 3
- 5510 Estates Ct
- 5521 Roman Point Ct
- 1627 Roman Point Dr
- 1608 Roman Point Dr Unit 3
- 5511 Roman Point Ct