Estimated Value: $268,000 - $315,000
3
Beds
2
Baths
1,637
Sq Ft
$178/Sq Ft
Est. Value
About This Home
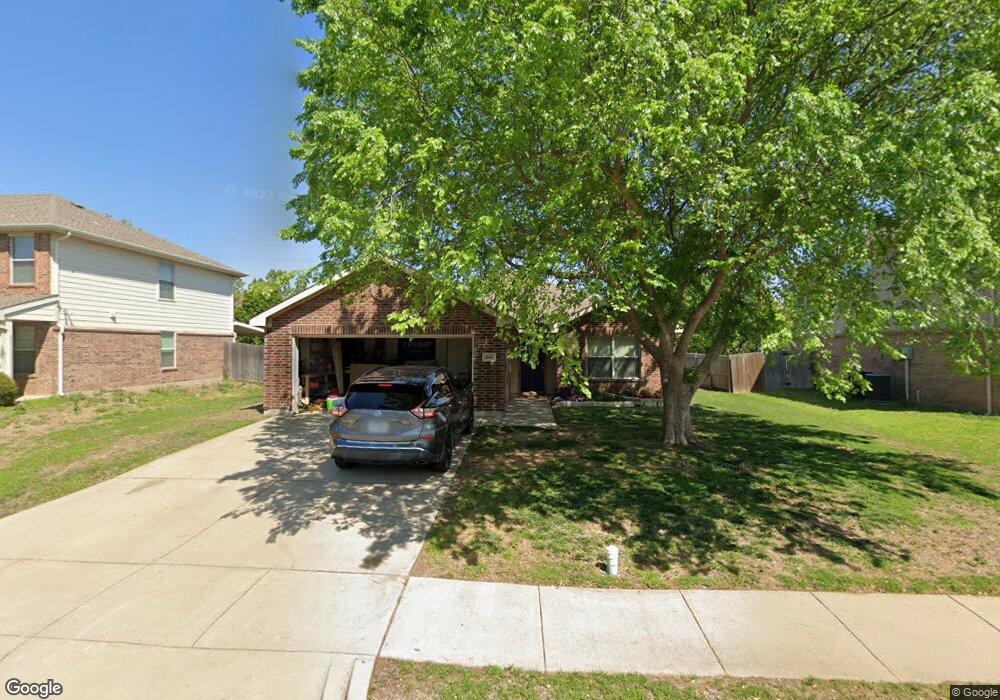
This home is located at 1647 Sequoia Dr, Krum, TX 76249 and is currently estimated at $291,063, approximately $177 per square foot. 1647 Sequoia Dr is a home located in Denton County with nearby schools including Krum Early Education Center, Blanche Dodd Intermediate School, and Krum Middle School.
Ownership History
Date
Name
Owned For
Owner Type
Purchase Details
Closed on
Sep 19, 2013
Sold by
Taylor Stephanie D
Bought by
Dawson Amber M
Current Estimated Value
Home Financials for this Owner
Home Financials are based on the most recent Mortgage that was taken out on this home.
Original Mortgage
$137,244
Outstanding Balance
$102,618
Interest Rate
4.45%
Mortgage Type
New Conventional
Estimated Equity
$188,445
Purchase Details
Closed on
Feb 16, 2010
Sold by
Eddington Candice C and Eddington Jason
Bought by
Tayloe Stephanie D
Home Financials for this Owner
Home Financials are based on the most recent Mortgage that was taken out on this home.
Original Mortgage
$117,727
Interest Rate
5.37%
Mortgage Type
FHA
Purchase Details
Closed on
Dec 9, 2004
Sold by
Hmh Lifestyles Lp
Bought by
Peacock Candice C
Home Financials for this Owner
Home Financials are based on the most recent Mortgage that was taken out on this home.
Original Mortgage
$116,166
Interest Rate
5.78%
Mortgage Type
FHA
Create a Home Valuation Report for This Property
The Home Valuation Report is an in-depth analysis detailing your home's value as well as a comparison with similar homes in the area
Home Values in the Area
Average Home Value in this Area
Purchase History
| Date | Buyer | Sale Price | Title Company |
|---|---|---|---|
| Dawson Amber M | -- | None Available | |
| Tayloe Stephanie D | -- | Fatco | |
| Peacock Candice C | -- | Fnt |
Source: Public Records
Mortgage History
| Date | Status | Borrower | Loan Amount |
|---|---|---|---|
| Open | Dawson Amber M | $137,244 | |
| Previous Owner | Tayloe Stephanie D | $117,727 | |
| Previous Owner | Peacock Candice C | $116,166 |
Source: Public Records
Tax History
| Year | Tax Paid | Tax Assessment Tax Assessment Total Assessment is a certain percentage of the fair market value that is determined by local assessors to be the total taxable value of land and additions on the property. | Land | Improvement |
|---|---|---|---|---|
| 2025 | $5,921 | $286,253 | $67,977 | $218,276 |
| 2024 | $5,921 | $293,835 | $67,977 | $225,858 |
| 2023 | $6,321 | $313,063 | $67,977 | $245,086 |
| 2022 | $5,873 | $256,035 | $67,977 | $188,058 |
| 2021 | $4,553 | $205,312 | $42,674 | $162,638 |
| 2020 | $4,322 | $190,870 | $42,674 | $148,196 |
| 2019 | $4,561 | $189,000 | $42,674 | $146,326 |
| 2018 | $4,277 | $176,354 | $42,674 | $133,680 |
| 2017 | $3,912 | $160,584 | $42,674 | $117,910 |
| 2016 | $3,547 | $145,615 | $28,324 | $117,291 |
| 2015 | $3,043 | $131,402 | $28,324 | $103,078 |
| 2013 | -- | $121,001 | $28,324 | $92,677 |
Source: Public Records
Map
Nearby Homes
- 1606 Withers Way
- 334 Saddlebrook Dr
- 105 Thoroughbred Dr
- 101 Thoroughbred Dr
- TBD Masch Branch Rd
- 3207 Camden Creek Rd
- 205 Comanche Trail
- 0 Farm To Market Road 1173
- 3425 Eloise Ln
- 905 Clearview St
- 3724 Ranchers Ridge
- TBD Hopkins Rd
- 3725 Ranchers Ridge
- 5276 Albert Ct
- 5258 Albert Ct
- 107 N 7th St
- 101 N 7th St
- 4124 Herdsman Dr
- 4125 Shady Ln
- 7272 Christina Ct
- 1649 Sequoia Dr
- 1643 Sequoia Dr
- 1630 Withers Way
- 1701 Santa fe Trail
- 1703 Santa fe Trail
- 1705 Santa fe Trail
- 1641 Sequoia Dr
- 1629 Withers Way
- 1628 Withers Way
- 1631 Santa fe Trail
- 1707 Santa fe Trail
- 1627 Withers Way
- 1639 Sequoia Dr
- 1626 Withers Way
- 1709 Santa fe Trail
- 1626 Appaloosa Dr
- 1627 Santa fe Trail
- 1625 Withers Way
- 1702 Santa fe Trail
- 1700 Santa fe Trail
Your Personal Tour Guide
Ask me questions while you tour the home.