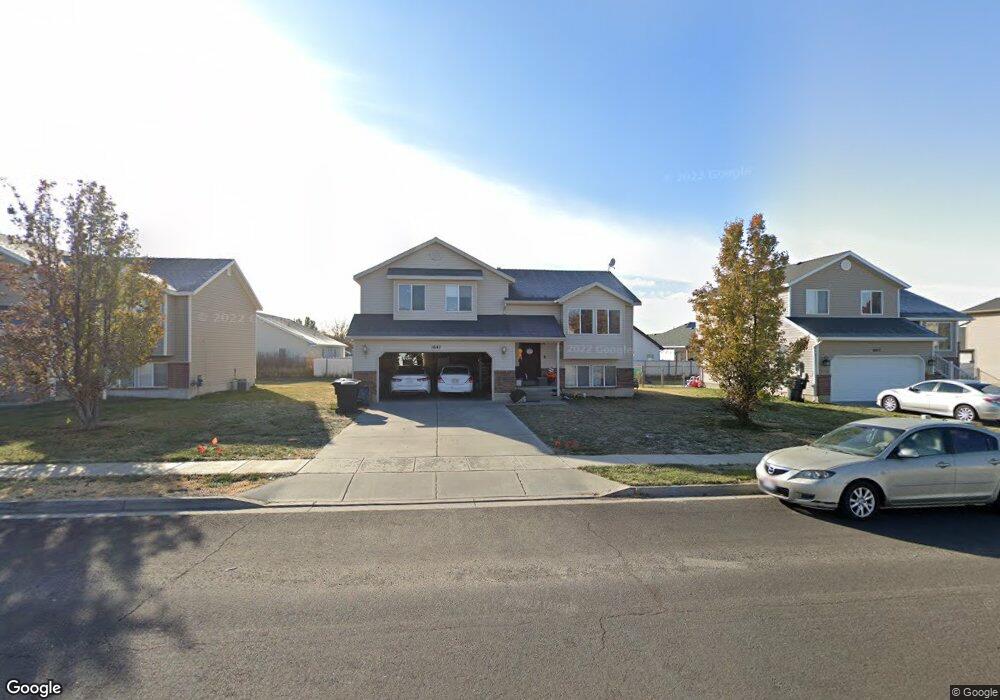
1647 W 600 N Clearfield, UT 84015
Estimated Value: $425,000 - $444,000
3
Beds
2
Baths
1,137
Sq Ft
$383/Sq Ft
Est. Value
About This Home
This home is located at 1647 W 600 N, Clearfield, UT 84015 and is currently estimated at $435,844, approximately $383 per square foot. 1647 W 600 N is a home located in Davis County with nearby schools including Lakeside School, West Point Junior High School, and Syracuse High School.
Ownership History
Date
Name
Owned For
Owner Type
Purchase Details
Closed on
Jan 29, 2020
Sold by
Engstrom Ronald J and Engstrom Donna Marie
Bought by
Engstrom Ronald J and Engstrom Donna M
Current Estimated Value
Purchase Details
Closed on
Sep 6, 2005
Sold by
Welbuilt Enterprises Inc
Bought by
Engstrom Ronald James and Engstrom Donna Marie
Home Financials for this Owner
Home Financials are based on the most recent Mortgage that was taken out on this home.
Original Mortgage
$135,120
Outstanding Balance
$74,188
Interest Rate
6.37%
Mortgage Type
Fannie Mae Freddie Mac
Estimated Equity
$361,656
Purchase Details
Closed on
Mar 11, 2005
Sold by
M & D Developers Llc
Bought by
Welbuilt Enterprises Inc
Home Financials for this Owner
Home Financials are based on the most recent Mortgage that was taken out on this home.
Original Mortgage
$128,000
Interest Rate
5.6%
Mortgage Type
Construction
Create a Home Valuation Report for This Property
The Home Valuation Report is an in-depth analysis detailing your home's value as well as a comparison with similar homes in the area
Home Values in the Area
Average Home Value in this Area
Purchase History
| Date | Buyer | Sale Price | Title Company |
|---|---|---|---|
| Engstrom Ronald J | -- | Hickman Land Title Co | |
| Engstrom Ronald James | -- | Mountain View Title & Escrow | |
| Welbuilt Enterprises Inc | -- | Heritage West Title Ins Agen |
Source: Public Records
Mortgage History
| Date | Status | Borrower | Loan Amount |
|---|---|---|---|
| Open | Engstrom Ronald James | $135,120 | |
| Previous Owner | Welbuilt Enterprises Inc | $128,000 |
Source: Public Records
Tax History
| Year | Tax Paid | Tax Assessment Tax Assessment Total Assessment is a certain percentage of the fair market value that is determined by local assessors to be the total taxable value of land and additions on the property. | Land | Improvement |
|---|---|---|---|---|
| 2025 | $2,208 | $212,300 | $85,155 | $127,145 |
| 2024 | $2,236 | $216,149 | $94,124 | $122,025 |
| 2023 | $2,041 | $200,750 | $58,397 | $142,352 |
| 2022 | $2,174 | $391,000 | $120,130 | $270,870 |
| 2021 | $2,003 | $294,000 | $80,820 | $213,180 |
| 2020 | $1,742 | $253,000 | $67,689 | $185,311 |
| 2019 | $1,677 | $238,000 | $80,934 | $157,066 |
| 2018 | $1,549 | $216,000 | $68,602 | $147,398 |
| 2016 | $1,356 | $97,625 | $25,587 | $72,038 |
| 2015 | $1,333 | $91,245 | $25,587 | $65,658 |
| 2014 | $1,359 | $94,501 | $25,587 | $68,914 |
| 2013 | -- | $89,460 | $24,320 | $65,140 |
Source: Public Records
Map
Nearby Homes
- 1654 W 600 N
- 1681 W 350 N
- 1411 W 570 N
- 575 N 1350 W Unit 137
- 1350 W 300 N Unit 29
- 563 N 1350 W Unit 139
- 1551 W 265 N
- 254 N 1600 W
- 607 N 2000 W
- 178 N 1850 W
- 184 N 1900 W
- 1251 W 400 N Unit 67
- 1239 W 400 N Unit 63
- 417 N 1200 W Unit 84
- 2132 W 800 N
- 1125 W 700 N
- 1161 W 325 N
- 303 N Canterbury Way
- 2283 W 470 N
- 1038 W 800 N
Your Personal Tour Guide
Ask me questions while you tour the home.