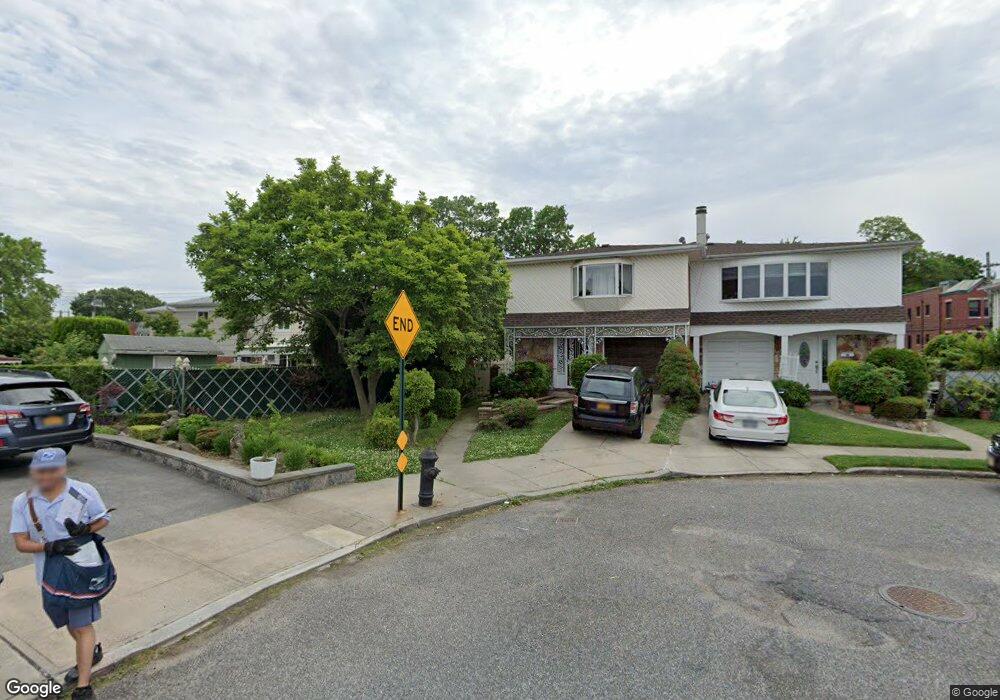
1648 154th St Whitestone, NY 11357
Whitestone NeighborhoodEstimated Value: $1,171,000 - $1,502,000
--
Bed
--
Bath
2,264
Sq Ft
$588/Sq Ft
Est. Value
About This Home
This home is located at 1648 154th St, Whitestone, NY 11357 and is currently estimated at $1,330,903, approximately $587 per square foot. 1648 154th St is a home located in Queens County with nearby schools including P.S. 209 - Clearview Gardens, J.H.S. 194 William Carr, and Bayside High School.
Ownership History
Date
Name
Owned For
Owner Type
Purchase Details
Closed on
May 17, 2022
Sold by
Minca As Trustee Robert
Bought by
Hu Yan Yan and Lin Meng Xiong
Current Estimated Value
Home Financials for this Owner
Home Financials are based on the most recent Mortgage that was taken out on this home.
Original Mortgage
$550,000
Outstanding Balance
$522,721
Interest Rate
5.3%
Mortgage Type
Purchase Money Mortgage
Estimated Equity
$808,182
Purchase Details
Closed on
Jan 28, 2021
Sold by
Minca Robert
Bought by
Robert Minca Trustee and Sonia Minca, Trustee
Purchase Details
Closed on
Aug 22, 2000
Sold by
Garofolo Antonino and Garofolo Rose
Bought by
Minca Robert and Minca Sonya
Home Financials for this Owner
Home Financials are based on the most recent Mortgage that was taken out on this home.
Original Mortgage
$425,000
Interest Rate
8.1%
Create a Home Valuation Report for This Property
The Home Valuation Report is an in-depth analysis detailing your home's value as well as a comparison with similar homes in the area
Home Values in the Area
Average Home Value in this Area
Purchase History
| Date | Buyer | Sale Price | Title Company |
|---|---|---|---|
| Hu Yan Yan | $1,235,000 | -- | |
| Robert Minca Trustee | -- | -- | |
| Minca Robert | $580,000 | First American Title Ins Co |
Source: Public Records
Mortgage History
| Date | Status | Borrower | Loan Amount |
|---|---|---|---|
| Open | Hu Yan Yan | $550,000 | |
| Previous Owner | Minca Robert | $425,000 |
Source: Public Records
Tax History Compared to Growth
Tax History
| Year | Tax Paid | Tax Assessment Tax Assessment Total Assessment is a certain percentage of the fair market value that is determined by local assessors to be the total taxable value of land and additions on the property. | Land | Improvement |
|---|---|---|---|---|
| 2025 | $11,754 | $61,510 | $11,581 | $49,929 |
| 2024 | $11,754 | $58,523 | $10,352 | $48,171 |
| 2023 | $11,594 | $57,727 | $10,147 | $47,580 |
| 2022 | $8,323 | $76,920 | $13,500 | $63,420 |
| 2021 | $10,741 | $69,960 | $13,500 | $56,460 |
| 2020 | $10,554 | $72,780 | $13,500 | $59,280 |
| 2019 | $9,909 | $68,940 | $13,500 | $55,440 |
| 2018 | $9,509 | $48,106 | $11,552 | $36,554 |
| 2017 | $9,144 | $46,326 | $12,727 | $33,599 |
| 2016 | $8,427 | $46,326 | $12,727 | $33,599 |
| 2015 | $5,051 | $42,715 | $13,980 | $28,735 |
| 2014 | $5,051 | $40,641 | $13,423 | $27,218 |
Source: Public Records
Map
Nearby Homes
- 17-02 Clintonville St
- 154-11 17th Ave
- 17 Murray St Unit 4FL
- 15-59 150th Place
- 150-28 17th Rd
- 158-22 16th Ave Unit 2
- 158-22 16th Ave Unit 6-64
- 150-29 16th Rd
- 157-03 Locke Ave
- 2005 Murray St
- 151-05 Cross Island Pkwy Unit 6C
- 151-05 Cross Island Pkwy Unit 1-D
- 154-09 21st Ave
- 154-19 21st Ave
- 151-25 21st Ave
- 157-57 17th Ave Unit 6125
- 14960 17th Rd
- 14-78 157th St
- 158-18 Cross Island Pkwy Unit 6-7
- 16-10 160th St Unit 686
- 16-48 154th St
- 1651 Clintonville St
- 16-51 Clintonville St Unit 2nd
- 16-51 Clintonville St
- 1646 154th St
- 1642 154th St
- 1655 Clintonville St
- 15405 17th Ave
- 1640 154th St
- 16-51 17 Ave
- 16-46 154th St Unit 1
- 16-51 154th St Unit 1
- 15405 17th Ave
- 15405 17th Ave Unit 1R
- 16-42 154th St Unit 1
- 15407 17th Ave
- 1647 154th St Unit 1
- 16-36 16 Dr
- 1647 154th St
- 15411 Locke Ave