Estimated Value: $125,000 - $143,000
2
Beds
1
Bath
960
Sq Ft
$140/Sq Ft
Est. Value
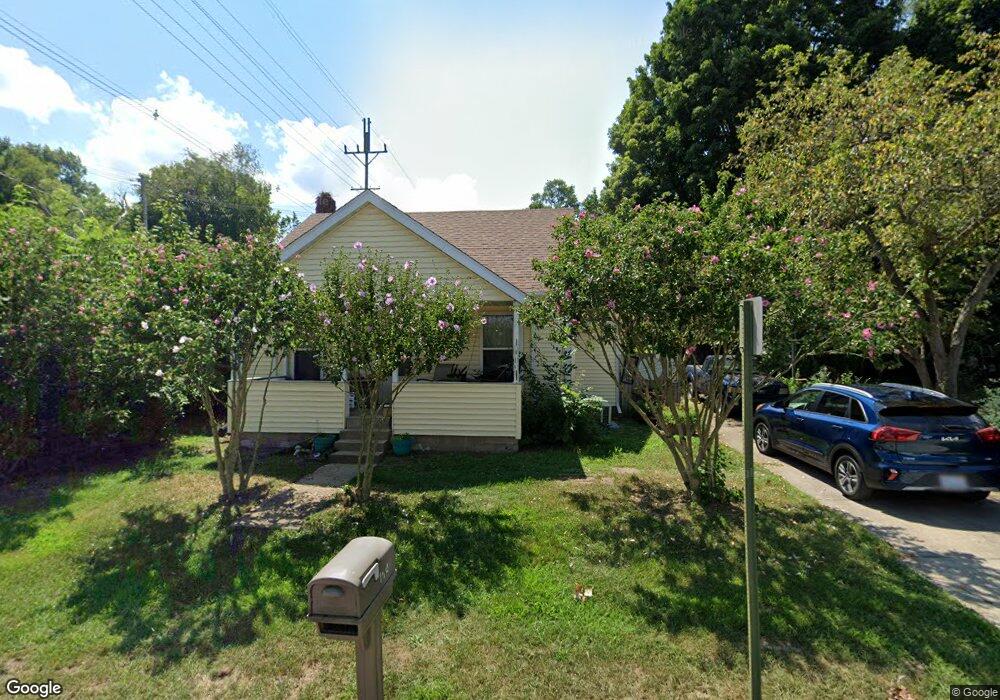
About This Home
This home is located at 1648 Cherry St, Niles, MI 49120 and is currently estimated at $134,614, approximately $140 per square foot. 1648 Cherry St is a home located in Berrien County with nearby schools including James Ellis School, Howard-Ellis Elementary School, and Oak Manor Sixth Grade Center.
Ownership History
Date
Name
Owned For
Owner Type
Purchase Details
Closed on
Jan 3, 2012
Sold by
Eisenhart Donna J and Guthrie Joan M
Bought by
Brandon Marc T
Current Estimated Value
Purchase Details
Closed on
May 8, 1997
Purchase Details
Closed on
Jun 18, 1996
Create a Home Valuation Report for This Property
The Home Valuation Report is an in-depth analysis detailing your home's value as well as a comparison with similar homes in the area
Home Values in the Area
Average Home Value in this Area
Purchase History
| Date | Buyer | Sale Price | Title Company |
|---|---|---|---|
| Brandon Marc T | $5,000 | None Available | |
| -- | $45,000 | -- | |
| -- | -- | -- |
Source: Public Records
Tax History
| Year | Tax Paid | Tax Assessment Tax Assessment Total Assessment is a certain percentage of the fair market value that is determined by local assessors to be the total taxable value of land and additions on the property. | Land | Improvement |
|---|---|---|---|---|
| 2025 | $846 | $53,500 | $0 | $0 |
| 2024 | $650 | $49,200 | $0 | $0 |
| 2023 | $623 | $43,500 | $0 | $0 |
| 2022 | $594 | $40,400 | $0 | $0 |
| 2021 | $737 | $38,200 | $3,800 | $34,400 |
| 2020 | $730 | $29,800 | $0 | $0 |
| 2019 | $721 | $33,900 | $8,700 | $25,200 |
| 2018 | $697 | $33,900 | $0 | $0 |
| 2017 | $686 | $28,600 | $0 | $0 |
| 2016 | $671 | $20,200 | $0 | $0 |
| 2015 | $669 | $18,500 | $0 | $0 |
| 2014 | $516 | $18,400 | $0 | $0 |
Source: Public Records
Map
Nearby Homes
- 1638 Superior St
- 324 S 15th St
- 1451 Cedar St
- 0 S 15th St
- V/L S 15th St
- 2112 Kathryn Dr
- V/L Kathryn St Unit Tract 3
- 2451 Spansail Dr
- 1408 Silverbrook Ave
- 1648 Oak St
- 0 Kathryn St Unit Tract 1
- 1008 Oak St
- 920 Cherry St
- 17 S 10th St
- 1314 Ferry St
- 1316 Eagle St
- 622 N 13th St
- 400 Carefree Ct
- 319 S 5th St
- 718 Regent St
Your Personal Tour Guide
Ask me questions while you tour the home.