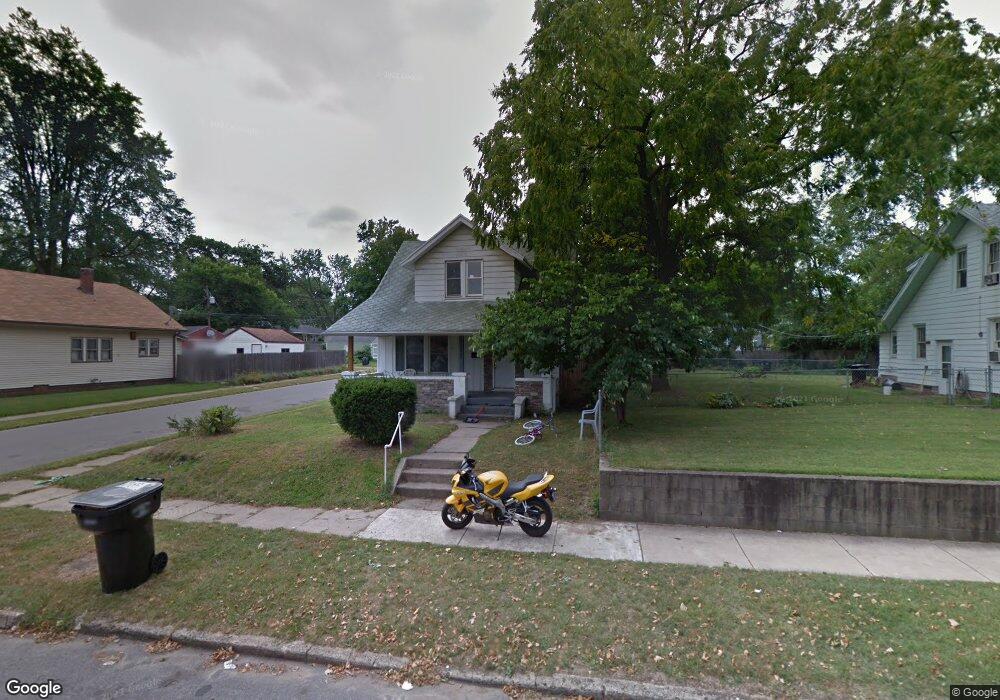
1648 E Bowman St South Bend, IN 46613
Estimated Value: $148,000 - $172,000
3
Beds
2
Baths
2,233
Sq Ft
$72/Sq Ft
Est. Value
About This Home
This home is located at 1648 E Bowman St, South Bend, IN 46613 and is currently estimated at $159,865, approximately $71 per square foot. 1648 E Bowman St is a home located in St. Joseph County with nearby schools including Lincoln Elementary School, Marshall Traditional School, and Clay Intermediate Center.
Ownership History
Date
Name
Owned For
Owner Type
Purchase Details
Closed on
Oct 2, 2020
Sold by
Great Lakes Regional Housing Llc
Bought by
Western Rentals Llc
Current Estimated Value
Purchase Details
Closed on
Nov 22, 2019
Sold by
Capital Housing Llc
Bought by
Great Lake Regional Housing Ll
Purchase Details
Closed on
Jul 24, 2018
Sold by
Pc6 Reo Llc
Bought by
Capital Housing Llc
Purchase Details
Closed on
Jul 2, 2018
Sold by
Pc6 Reo Llc
Bought by
Capital Housing Llc
Purchase Details
Closed on
Mar 23, 2018
Sold by
St Joseph County Auditor
Bought by
Pc 6 Reo Llc
Purchase Details
Closed on
Apr 12, 2007
Sold by
Kalin Rodriguez Carol L and Rodriguez Lawrence I
Bought by
Citimortgage Inc and Associates Home Equity Servies Inc
Create a Home Valuation Report for This Property
The Home Valuation Report is an in-depth analysis detailing your home's value as well as a comparison with similar homes in the area
Home Values in the Area
Average Home Value in this Area
Purchase History
| Date | Buyer | Sale Price | Title Company |
|---|---|---|---|
| Western Rentals Llc | -- | Sdk | |
| Great Lake Regional Housing Ll | -- | None Listed On Document | |
| Capital Housing Llc | $6,750 | Fidelity National Title | |
| Capital Housing Llc | $6,750 | Fidelity National Title | |
| Pc 6 Reo Llc | $4,506 | -- | |
| Citimortgage Inc | $32,900 | None Available |
Source: Public Records
Mortgage History
| Date | Status | Borrower | Loan Amount |
|---|---|---|---|
| Previous Owner | D Journey Leasing Inc | $94,000 | |
| Previous Owner | D Journey Leasing Inc | $20,000 | |
| Previous Owner | D Journey Leasing Inc | $45,000 |
Source: Public Records
Tax History Compared to Growth
Tax History
| Year | Tax Paid | Tax Assessment Tax Assessment Total Assessment is a certain percentage of the fair market value that is determined by local assessors to be the total taxable value of land and additions on the property. | Land | Improvement |
|---|---|---|---|---|
| 2024 | $2,770 | $136,200 | $6,800 | $129,400 |
| 2023 | $2,745 | $114,400 | $6,800 | $107,600 |
| 2022 | $2,745 | $114,400 | $6,800 | $107,600 |
| 2021 | $2,121 | $84,800 | $5,500 | $79,300 |
| 2020 | $1,802 | $73,300 | $4,800 | $68,500 |
| 2019 | $1,495 | $72,600 | $4,700 | $67,900 |
| 2018 | $1,589 | $63,100 | $4,100 | $59,000 |
| 2017 | $1,264 | $49,000 | $3,200 | $45,800 |
| 2016 | $1,291 | $49,000 | $3,200 | $45,800 |
| 2014 | $1,354 | $51,800 | $3,400 | $48,400 |
Source: Public Records
Map
Nearby Homes
- 1710 E Calvert St
- 1610 E Donald St
- 1516 E Fox St
- 1715 Altgeld St
- 1902 Randolph St
- 1708 Altgeld St
- 1911 S Ironwood Dr
- 1405 Randolph St
- 1339 E Bowman St
- 1715 Southeast Dr
- 2710 Milburn Blvd
- 1613 Leer St
- 913 Geyer Ave
- 1220 E Fox St
- 205 N Middleboro Ave
- 1133 E Donald St
- 2416 Milburn Blvd
- 137 Monmoor Ave
- 2910 Woodmont Dr
- 1160 E Indiana Ave
- 1702 E Bowman St
- 1640 E Bowman St
- 1706 E Bowman St
- 1638 E Bowman St
- 2017 Robinson St
- 1712 E Bowman St
- 1634 E Bowman St
- 1701 E Donald St
- 1641 E Donald St
- 1649 E Bowman St
- 1705 E Donald St
- 1645 E Bowman St
- 1714 E Bowman St
- 1637 E Donald St
- 1630 E Bowman St
- 1641 E Bowman St
- 1922 Robinson St
- 1709 E Donald St
- 1705 E Bowman St
- 1639 E Bowman St