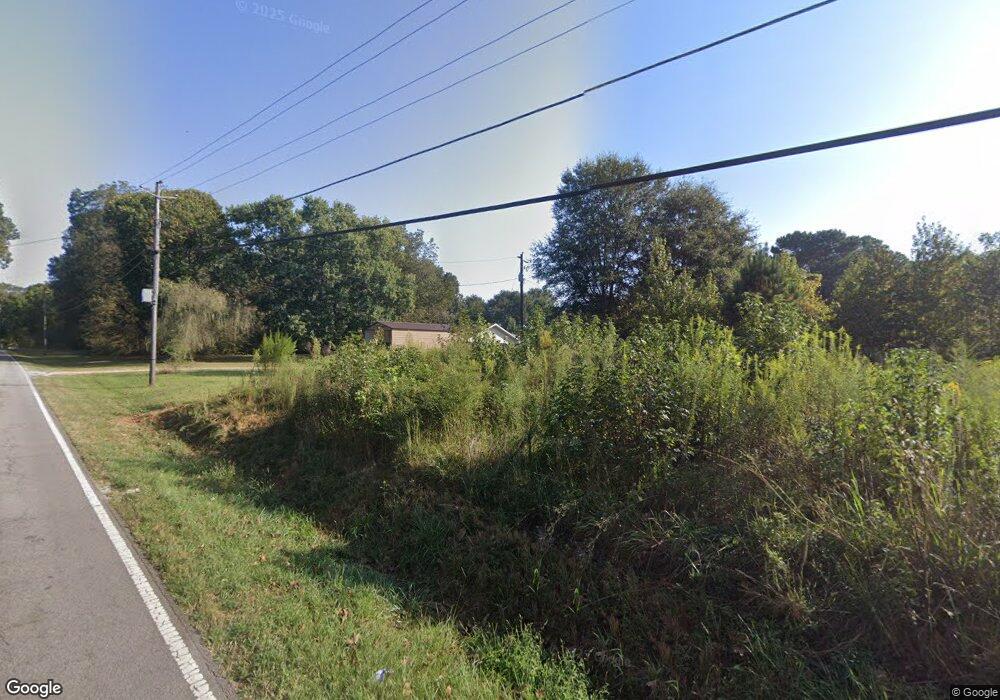
1648 Lowell Rd Carrollton, GA 30116
Estimated Value: $459,000 - $2,505,577
3
Beds
2
Baths
1,494
Sq Ft
$694/Sq Ft
Est. Value
About This Home
This home is located at 1648 Lowell Rd, Carrollton, GA 30116 and is currently estimated at $1,037,144, approximately $694 per square foot. 1648 Lowell Rd is a home located in Carroll County with nearby schools including Roopville Elementary School, Central Middle School, and Central High School.
Ownership History
Date
Name
Owned For
Owner Type
Purchase Details
Closed on
Jul 9, 2020
Sold by
Ly Tam Nhon Estate
Bought by
Hup Van
Current Estimated Value
Home Financials for this Owner
Home Financials are based on the most recent Mortgage that was taken out on this home.
Original Mortgage
$1,467,130
Outstanding Balance
$926,362
Interest Rate
3.2%
Mortgage Type
New Conventional
Estimated Equity
$110,782
Purchase Details
Closed on
Mar 27, 2017
Sold by
Rasico Ted
Bought by
Ly Tam Nhon
Purchase Details
Closed on
Jun 1, 2007
Sold by
Eidson H Scott
Bought by
Rasico Ted W
Home Financials for this Owner
Home Financials are based on the most recent Mortgage that was taken out on this home.
Original Mortgage
$1,096,000
Interest Rate
6.12%
Mortgage Type
New Conventional
Purchase Details
Closed on
Dec 6, 1996
Sold by
Eidson
Bought by
Eidson Harry S
Purchase Details
Closed on
Oct 2, 1996
Sold by
Eidson
Bought by
Eidson Eidson H and Eidson Wanda
Purchase Details
Closed on
Nov 16, 1992
Bought by
Eidson
Purchase Details
Closed on
Jan 13, 1990
Bought by
Eidson
Create a Home Valuation Report for This Property
The Home Valuation Report is an in-depth analysis detailing your home's value as well as a comparison with similar homes in the area
Home Values in the Area
Average Home Value in this Area
Purchase History
| Date | Buyer | Sale Price | Title Company |
|---|---|---|---|
| Hup Van | $1,512,500 | -- | |
| Ly Tam Nhon | $1,150,000 | -- | |
| Rasico Ted W | $1,370,000 | -- | |
| Eidson James G | -- | -- | |
| Eidson Harry S | -- | -- | |
| Eidson Eidson H | -- | -- | |
| Eidson | $55,000 | -- | |
| Eidson | $35,000 | -- |
Source: Public Records
Mortgage History
| Date | Status | Borrower | Loan Amount |
|---|---|---|---|
| Open | Hup Van | $1,467,130 | |
| Previous Owner | Eidson James G | $1,096,000 |
Source: Public Records
Tax History Compared to Growth
Tax History
| Year | Tax Paid | Tax Assessment Tax Assessment Total Assessment is a certain percentage of the fair market value that is determined by local assessors to be the total taxable value of land and additions on the property. | Land | Improvement |
|---|---|---|---|---|
| 2024 | $3,115 | $227,451 | $110,235 | $117,216 |
| 2023 | $3,115 | $199,056 | $88,188 | $110,868 |
| 2022 | $3,897 | $155,392 | $58,792 | $96,600 |
| 2021 | $3,496 | $136,375 | $47,034 | $89,341 |
| 2020 | $3,277 | $127,652 | $44,810 | $82,842 |
| 2019 | $3,108 | $124,105 | $44,810 | $79,295 |
| 2018 | $2,774 | $105,640 | $31,670 | $73,970 |
| 2017 | $2,061 | $105,640 | $31,670 | $73,970 |
| 2016 | $2,053 | $105,640 | $31,670 | $73,970 |
| 2015 | $1,976 | $96,708 | $31,978 | $64,730 |
| 2014 | $1,977 | $96,708 | $31,978 | $64,730 |
Source: Public Records
Map
Nearby Homes
- 2992 Clem Lowell Rd
- 3011 Clem Lowell Rd
- 2978 Clem Lowell Rd
- 2991 Clem Lowell Rd
- 1532 Lowell Rd
- 1651 Lowell Rd
- 1700 Lowell Rd
- 98 Mount Lowell Rd
- 73 Mt Lowell Rd
- 73 Mount Lowell Rd
- 1500 Lowell Rd
- 57 Mt Lowell Rd
- 2953 Clem Lowell Rd
- 1724 Lowell Rd
- 2900 Clem Lowell Rd
- 1490 Lowell Rd
- 2728 E Highway 5
- 1725 Lowell Rd
- 2911 Clem Lowell Rd
- 2880 Clem Lowell Rd