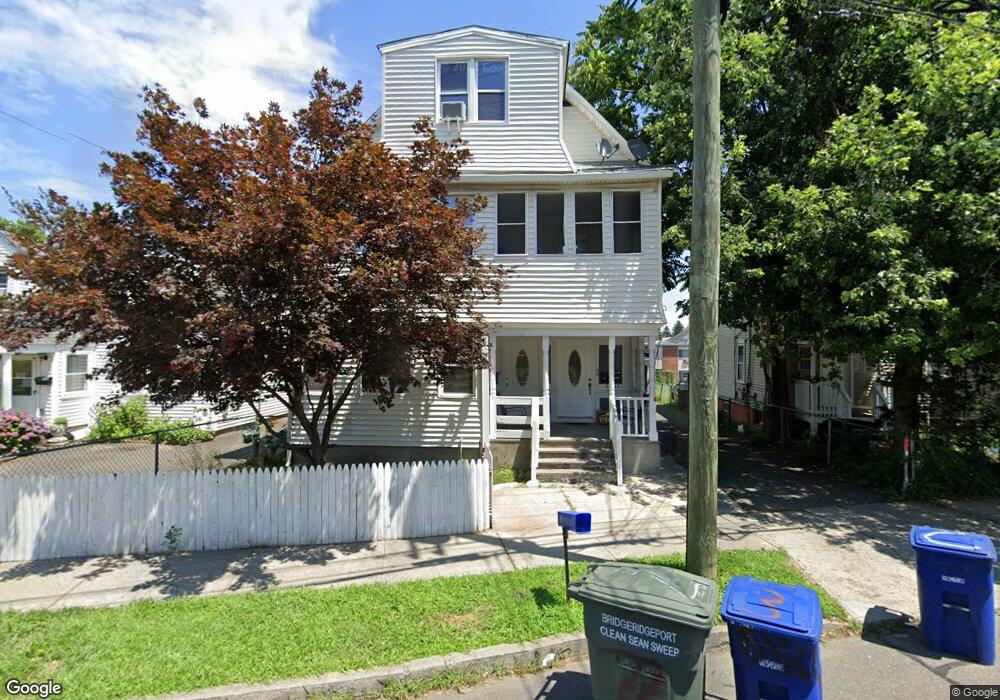
1648 Madison Ave Unit 1650 Bridgeport, CT 06606
North End NeighborhoodEstimated Value: $618,000 - $796,000
6
Beds
3
Baths
2,773
Sq Ft
$254/Sq Ft
Est. Value
About This Home
This home is located at 1648 Madison Ave Unit 1650, Bridgeport, CT 06606 and is currently estimated at $704,000, approximately $253 per square foot. 1648 Madison Ave Unit 1650 is a home located in Fairfield County with nearby schools including Blackham School, Central High School, and Assumption Catholic School.
Ownership History
Date
Name
Owned For
Owner Type
Purchase Details
Closed on
Apr 20, 2010
Sold by
Hm Prop 2 Llc
Bought by
Hm Prop 3 Llc
Current Estimated Value
Purchase Details
Closed on
Jan 19, 2010
Sold by
Hsbc Bank Usa
Bought by
Hm Properties 2 Llc
Purchase Details
Closed on
Dec 28, 2006
Sold by
Yoguez Guillermo and Yoguez Bibiana
Bought by
Veliz Jose
Home Financials for this Owner
Home Financials are based on the most recent Mortgage that was taken out on this home.
Original Mortgage
$360,000
Interest Rate
6.87%
Purchase Details
Closed on
Apr 12, 2005
Sold by
Huynh Ben
Bought by
Yoguez Guillermo and Yoguez Bibiana
Purchase Details
Closed on
May 20, 2004
Sold by
Hernandez Elsie
Bought by
Huynh Ben
Purchase Details
Closed on
Apr 16, 1999
Sold by
Peoples Bk
Bought by
Hernandez Elsie
Create a Home Valuation Report for This Property
The Home Valuation Report is an in-depth analysis detailing your home's value as well as a comparison with similar homes in the area
Home Values in the Area
Average Home Value in this Area
Purchase History
| Date | Buyer | Sale Price | Title Company |
|---|---|---|---|
| Hm Prop 3 Llc | -- | -- | |
| Hm Prop 3 Llc | -- | -- | |
| Hm Properties 2 Llc | $216,140 | -- | |
| Hsbc Bank Usa | -- | -- | |
| Hsbc Bank Usa | -- | -- | |
| Veliz Jose | $450,000 | -- | |
| Veliz Jose | $450,000 | -- | |
| Yoguez Guillermo | $400,000 | -- | |
| Yoguez Guillermo | $400,000 | -- | |
| Huynh Ben | $250,000 | -- | |
| Huynh Ben | $250,000 | -- | |
| Hernandez Elsie | $107,500 | -- | |
| Hernandez Elsie | $107,500 | -- |
Source: Public Records
Mortgage History
| Date | Status | Borrower | Loan Amount |
|---|---|---|---|
| Previous Owner | Hernandez Elsie | $360,000 | |
| Previous Owner | Hernandez Elsie | $90,000 |
Source: Public Records
Tax History Compared to Growth
Tax History
| Year | Tax Paid | Tax Assessment Tax Assessment Total Assessment is a certain percentage of the fair market value that is determined by local assessors to be the total taxable value of land and additions on the property. | Land | Improvement |
|---|---|---|---|---|
| 2025 | $9,842 | $226,504 | $68,014 | $158,490 |
| 2024 | $9,842 | $226,504 | $68,014 | $158,490 |
| 2023 | $9,842 | $226,504 | $68,014 | $158,490 |
| 2022 | $9,842 | $226,504 | $68,014 | $158,490 |
| 2021 | $9,842 | $226,504 | $68,014 | $158,490 |
| 2020 | $8,752 | $162,110 | $38,400 | $123,710 |
| 2019 | $8,752 | $162,110 | $38,400 | $123,710 |
| 2018 | $8,814 | $162,110 | $38,400 | $123,710 |
| 2017 | $8,814 | $162,110 | $38,400 | $123,710 |
| 2016 | $8,814 | $162,110 | $38,400 | $123,710 |
| 2015 | $8,801 | $208,550 | $46,440 | $162,110 |
| 2014 | $8,801 | $208,550 | $46,440 | $162,110 |
Source: Public Records
Map
Nearby Homes
- 485 Westfield Ave
- 105 Tremont Ave Unit E
- 105 Tremont Ave Unit B
- 631 Fairview Ave
- 520 Savoy St
- 681 Westfield Ave
- 376 Savoy St
- 252 Harlem Ave Unit B6
- 252 Harlem Ave Unit B5
- 203 Wayne St
- 234 Savoy St
- 241 Sampson St
- 11 Myron Ave
- 123 Harlem Ave
- 106 Manhattan Ave Unit 108
- 3200 Park Ave Unit 11C2
- 3200 Park Ave Unit 11E2
- 150 Alexander Dr
- 508 Hawley Ave
- 604 Birmingham St
- 1640 Madison Ave Unit 1642
- 1654 Madison Ave
- 775 Fairview Ave
- 1645 Madison Ave Unit 1647
- 779 Fairview Ave
- 1630 Madison Ave Unit D
- 1630 Madison Ave Unit B
- 1630 Madison Ave Unit E
- 1630 Madison Ave Unit F
- 1630 Madison Ave Unit C
- 1630 Madison Ave Unit A
- 17 Bowker Place
- 1635 Madison Ave Unit 1637
- 753 Fairview Ave
- 1629 Madison Ave
- 210 Tremont Ave
- 210 Tremont Ave Unit 6
- 210 Tremont Ave Unit 5
- 210 Tremont Ave Unit 1
- 770 Fairview Ave