Estimated Value: $133,000 - $201,000
3
Beds
1
Bath
896
Sq Ft
$182/Sq Ft
Est. Value
About This Home
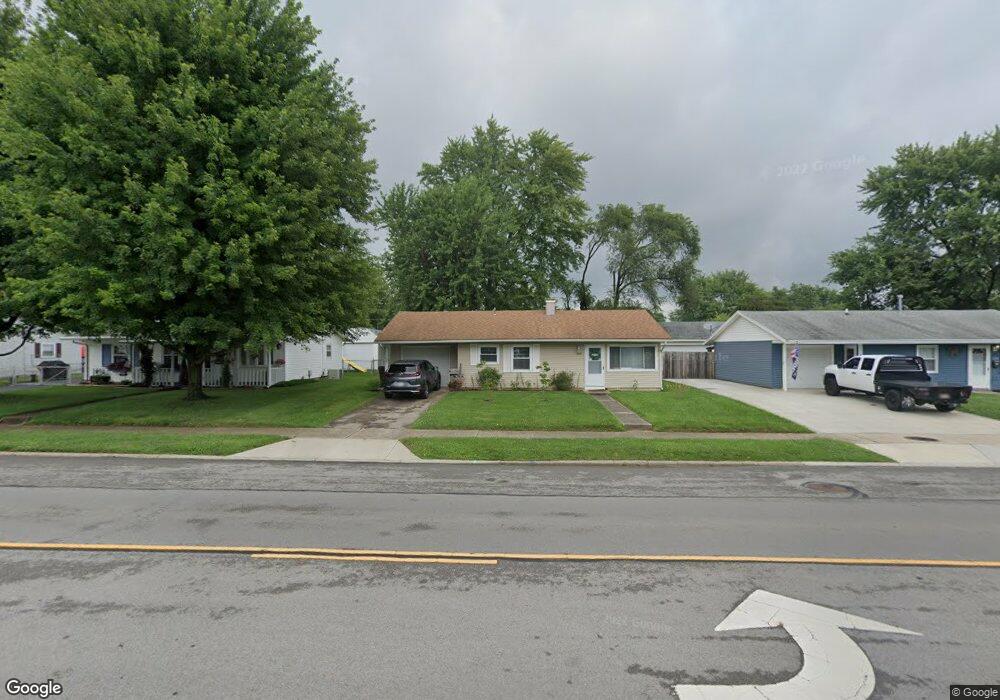
This home is located at 1648 W 2nd St, Xenia, OH 45385 and is currently estimated at $163,456, approximately $182 per square foot. 1648 W 2nd St is a home located in Greene County with nearby schools including Xenia High School, Summit Academy Community School for Alternative Learners - Xenia, and Legacy Christian Academy.
Ownership History
Date
Name
Owned For
Owner Type
Purchase Details
Closed on
Aug 30, 2021
Sold by
Wadella Tracie Ann and Estate Of Roxie B Hilderbrandt
Bought by
Kiskis Terry E
Current Estimated Value
Home Financials for this Owner
Home Financials are based on the most recent Mortgage that was taken out on this home.
Original Mortgage
$105,210
Interest Rate
2.7%
Mortgage Type
New Conventional
Purchase Details
Closed on
Jul 24, 2003
Sold by
Hiney Glenn E and Hiney Nancy B
Bought by
Vandine Charles and Hilderbrandt Roxie B
Home Financials for this Owner
Home Financials are based on the most recent Mortgage that was taken out on this home.
Original Mortgage
$65,000
Interest Rate
5.31%
Mortgage Type
Unknown
Create a Home Valuation Report for This Property
The Home Valuation Report is an in-depth analysis detailing your home's value as well as a comparison with similar homes in the area
Home Values in the Area
Average Home Value in this Area
Purchase History
| Date | Buyer | Sale Price | Title Company |
|---|---|---|---|
| Kiskis Terry E | $116,900 | None Available | |
| Vandine Charles | $65,000 | -- |
Source: Public Records
Mortgage History
| Date | Status | Borrower | Loan Amount |
|---|---|---|---|
| Previous Owner | Kiskis Terry E | $105,210 | |
| Previous Owner | Vandine Charles | $65,000 |
Source: Public Records
Tax History Compared to Growth
Tax History
| Year | Tax Paid | Tax Assessment Tax Assessment Total Assessment is a certain percentage of the fair market value that is determined by local assessors to be the total taxable value of land and additions on the property. | Land | Improvement |
|---|---|---|---|---|
| 2024 | $1,166 | $37,760 | $9,740 | $28,020 |
| 2023 | $1,166 | $37,760 | $9,740 | $28,020 |
| 2022 | $857 | $26,280 | $6,950 | $19,330 |
| 2021 | $869 | $26,280 | $6,950 | $19,330 |
| 2020 | $831 | $26,280 | $6,950 | $19,330 |
| 2019 | $708 | $22,790 | $4,680 | $18,110 |
| 2018 | $710 | $22,790 | $4,680 | $18,110 |
| 2017 | $652 | $22,790 | $4,680 | $18,110 |
| 2016 | $652 | $21,410 | $4,680 | $16,730 |
| 2015 | $654 | $21,410 | $4,680 | $16,730 |
| 2014 | $626 | $21,410 | $4,680 | $16,730 |
Source: Public Records
Map
Nearby Homes
- 1144 Rockwell Dr
- 1342 Kylemore Dr
- 1568 Cheyenne Dr
- 1391 June Dr
- 1283 June Dr
- 1618 Navajo Dr
- 1233 June Dr
- 1223 June Dr
- 121 S Progress Dr
- 1653 Seneca Dr
- 1208 Bellbrook Ave
- 1272 Bellbrook Ave
- 1778 Arapaho Dr
- 2758 Wyoming Dr
- 1351 Omard Dr
- 343 Sheelin Rd
- 1769 Gayhart Dr
- 219 Kansas Dr
- 1829 Gayhart Dr
- 1866 Roxbury Dr