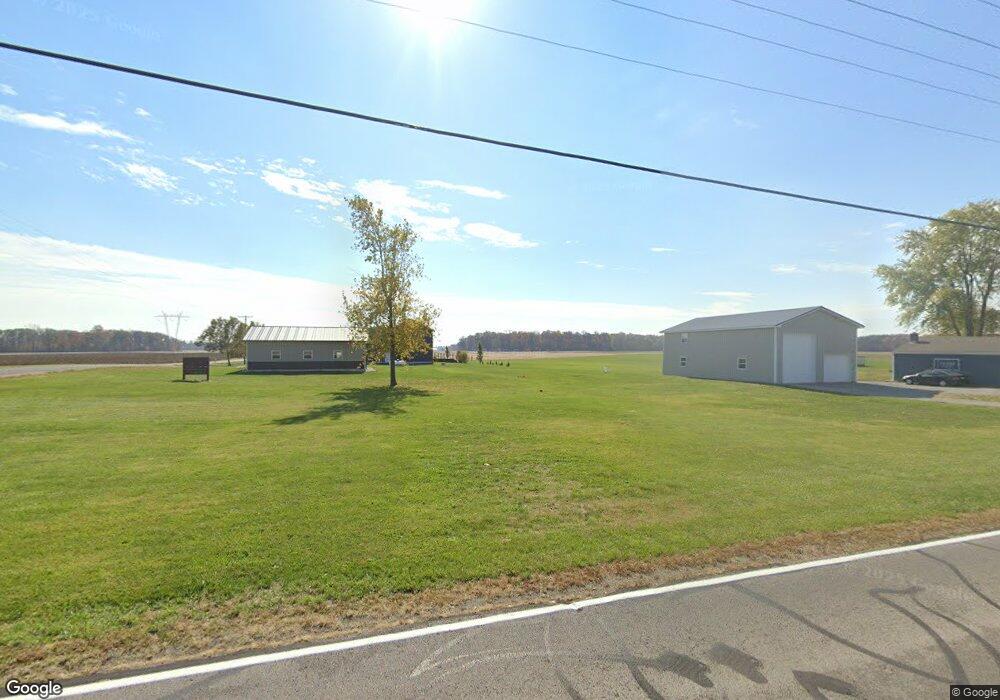
16480 Botkins Rd Botkins, OH 45306
Estimated Value: $53,000 - $436,000
Studio
--
Bath
--
Sq Ft
21,780
Sq Ft Lot
About This Home
This home is located at 16480 Botkins Rd, Botkins, OH 45306 and is currently estimated at $232,667. 16480 Botkins Rd is a home located in Shelby County with nearby schools including Botkins Elementary School and Botkins High School.
Ownership History
Date
Name
Owned For
Owner Type
Purchase Details
Closed on
Jan 22, 2010
Sold by
Thomas Caleb M and Thomas Christen
Bought by
Carter Patrick S and Carter Wendy S
Current Estimated Value
Home Financials for this Owner
Home Financials are based on the most recent Mortgage that was taken out on this home.
Original Mortgage
$125,000
Outstanding Balance
$80,666
Interest Rate
5.09%
Mortgage Type
Purchase Money Mortgage
Estimated Equity
$152,001
Purchase Details
Closed on
Feb 18, 2003
Sold by
Fultz Choice A
Bought by
Thomas Caleb M
Home Financials for this Owner
Home Financials are based on the most recent Mortgage that was taken out on this home.
Original Mortgage
$78,375
Interest Rate
5.94%
Mortgage Type
New Conventional
Purchase Details
Closed on
Jun 11, 1996
Sold by
Buehler Betty M
Bought by
Choice A Fultz
Home Financials for this Owner
Home Financials are based on the most recent Mortgage that was taken out on this home.
Original Mortgage
$60,000
Interest Rate
8%
Mortgage Type
New Conventional
Create a Home Valuation Report for This Property
The Home Valuation Report is an in-depth analysis detailing your home's value as well as a comparison with similar homes in the area
Purchase History
| Date | Buyer | Sale Price | Title Company |
|---|---|---|---|
| Carter Patrick S | $175,000 | Landmark Title Agency South | |
| Thomas Caleb M | $82,500 | -- | |
| Choice A Fultz | $75,000 | -- |
Source: Public Records
Mortgage History
| Date | Status | Borrower | Loan Amount |
|---|---|---|---|
| Open | Carter Patrick S | $125,000 | |
| Previous Owner | Thomas Caleb M | $78,375 | |
| Previous Owner | Choice A Fultz | $60,000 |
Source: Public Records
Tax History
| Year | Tax Paid | Tax Assessment Tax Assessment Total Assessment is a certain percentage of the fair market value that is determined by local assessors to be the total taxable value of land and additions on the property. | Land | Improvement |
|---|---|---|---|---|
| 2025 | $32 | $840 | $840 | $0 |
| 2024 | $32 | $840 | $840 | $0 |
| 2023 | $32 | $840 | $840 | $0 |
| 2022 | $159 | $3,880 | $3,880 | $0 |
| 2021 | $158 | $3,880 | $3,880 | $0 |
| 2020 | $161 | $3,880 | $3,880 | $0 |
| 2019 | $131 | $3,220 | $3,220 | $0 |
| 2018 | $126 | $3,220 | $3,220 | $0 |
| 2017 | $127 | $3,220 | $3,220 | $0 |
| 2016 | $104 | $2,680 | $2,680 | $0 |
| 2015 | $103 | $2,680 | $2,680 | $0 |
| 2014 | $103 | $2,680 | $2,680 | $0 |
| 2013 | $107 | $2,680 | $2,680 | $0 |
Source: Public Records
Map
Nearby Homes
- 16442 Botkins Rd
- 18425 Reineke Schipper Rd
- 18425 Reineke Schipper Rd
- 16396 Botkins Rd
- 16424 Botkins Rd
- 16424 Botkins Rd
- 16503 Botkins Rd
- 16293 Botkins Rd
- 16695 Botkins Rd
- 16162 Botkins Rd
- 16855 Botkins Rd
- 16881 Botkins Rd
- 16975 Botkins Rd
- 18015 Reineke Schipper Rd
- 15900 Botkins Rd
- 18587 Reineke Schipper Rd
- 18751 Reineke Schipper Rd
- 18807 Reineke Schipper Rd
- 15836 Botkins Rd
- 15836 Botkins Rd
Your Personal Tour Guide
Ask me questions while you tour the home.