1649 Jimson Ct Boulder, CO 80304
North Boulder NeighborhoodEstimated Value: $1,705,216 - $2,312,000
About This Home
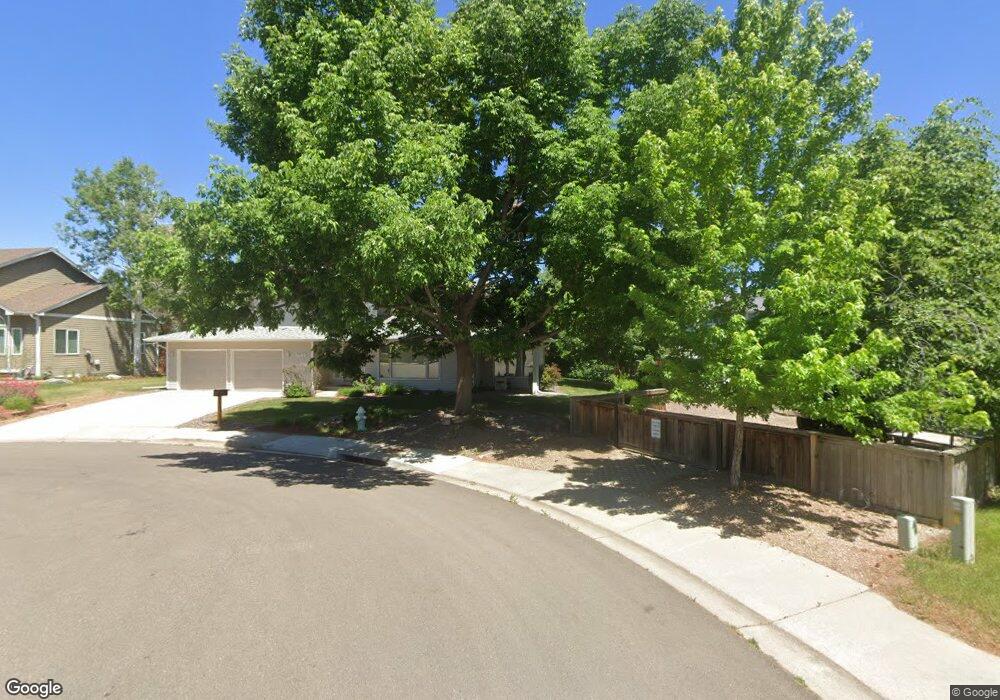
This home is located at 1649 Jimson Ct, Boulder, CO 80304 and is currently estimated at $1,975,054, approximately $793 per square foot. 1649 Jimson Ct is a home located in Boulder County with nearby schools including Foothill Elementary School, Centennial Middle School, and Boulder High School.
Ownership History
We collect this data history from publicly available records. To have your information removed, we recommend requesting removal directly through your county’s website.
Purchase Details
Purchase Details
Purchase Details
Purchase Details
Home Values in the Area
Average Home Value in this Area
Purchase History
We collect this data history from publicly available records. To have your information removed, we recommend requesting removal directly through your county’s website.
| Date | Buyer | Sale Price | Title Company |
|---|---|---|---|
| $52,200 | -- | ||
| -- | -- | ||
| -- | -- | ||
| -- | -- |
Tax History
We collect this data history from publicly available records. To have your information removed, we recommend requesting removal directly through your county’s website.
| Year | Tax Paid | Tax Assessment Tax Assessment Total Assessment is a certain percentage of the fair market value that is determined by local assessors to be the total taxable value of land and additions on the property. | Land | Improvement |
|---|---|---|---|---|
| 2026 | $8,891 | $108,256 | $43,914 | $64,342 |
| 2025 | $8,891 | $108,256 | $43,914 | $64,342 |
| 2024 | $9,097 | $109,744 | $40,363 | $69,381 |
| 2023 | $10,031 | $110,215 | $42,156 | $71,744 |
| 2022 | $5,964 | $71,168 | $33,714 | $37,454 |
| 2021 | $5,687 | $73,216 | $34,685 | $38,531 |
| 2020 | $5,352 | $68,641 | $31,103 | $37,538 |
| 2019 | $5,883 | $68,641 | $31,103 | $37,538 |
| 2018 | $5,212 | $60,120 | $29,376 | $30,744 |
| 2017 | $5,049 | $75,700 | $32,477 | $43,223 |
| 2016 | $5,290 | $61,109 | $27,701 | $33,408 |
| 2015 | $5,009 | $50,610 | $20,378 | $30,232 |
| 2014 | $4,255 | $50,610 | $20,378 | $30,232 |
Map
- 1717 Iris Ave
- 3355 16th St
- 3497 Iris Ct
- 1845 Iris Ave
- 1760 Hawthorn Place
- 1850 Iris Ave
- 3501 19th St
- 1930 Grape Ave
- 3565 19th St
- 2006 Joslyn Place
- 1400 Kalmia Ave
- 3501 Kirkwood Place
- 3600 Cloverleaf Dr
- 1920 Grape Ave
- 3255 20th St
- 3360 Broadway St
- 3150 19th St
- 3319 Broadway
- 1720 Lombardy Dr
- 3315 Broadway St
Ask me questions while you tour the home.