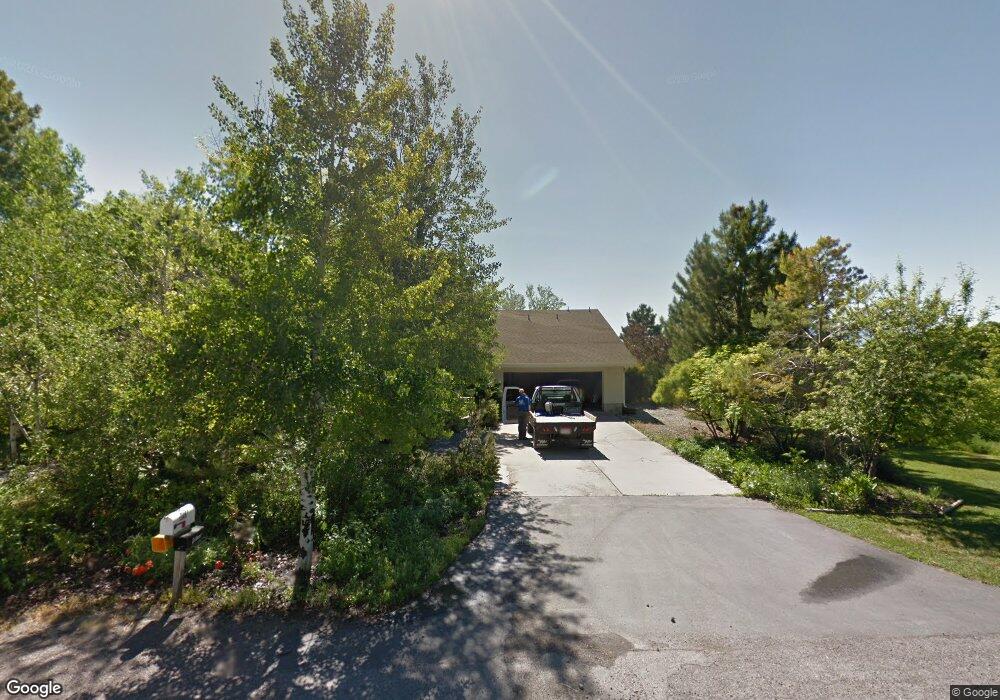
1649 N 1000 E North Logan, UT 84341
Estimated Value: $712,000 - $897,885
4
Beds
3
Baths
3,382
Sq Ft
$235/Sq Ft
Est. Value
About This Home
This home is located at 1649 N 1000 E, North Logan, UT 84341 and is currently estimated at $796,295, approximately $235 per square foot. 1649 N 1000 E is a home located in Cache County with nearby schools including Greenville School, Cedar Ridge School, and North Cache Middle School.
Ownership History
Date
Name
Owned For
Owner Type
Purchase Details
Closed on
Oct 7, 2013
Sold by
Ryel Ronald J and Springs Melanie K
Bought by
Hullinger Gordon and Hullinger Ann
Current Estimated Value
Home Financials for this Owner
Home Financials are based on the most recent Mortgage that was taken out on this home.
Original Mortgage
$267,500
Outstanding Balance
$191,655
Interest Rate
3.5%
Mortgage Type
Adjustable Rate Mortgage/ARM
Estimated Equity
$604,640
Create a Home Valuation Report for This Property
The Home Valuation Report is an in-depth analysis detailing your home's value as well as a comparison with similar homes in the area
Home Values in the Area
Average Home Value in this Area
Purchase History
| Date | Buyer | Sale Price | Title Company |
|---|---|---|---|
| Hullinger Gordon | -- | Pinnacle Title Ins Agency |
Source: Public Records
Mortgage History
| Date | Status | Borrower | Loan Amount |
|---|---|---|---|
| Open | Hullinger Gordon | $267,500 |
Source: Public Records
Tax History
| Year | Tax Paid | Tax Assessment Tax Assessment Total Assessment is a certain percentage of the fair market value that is determined by local assessors to be the total taxable value of land and additions on the property. | Land | Improvement |
|---|---|---|---|---|
| 2025 | $34 | $470,465 | $0 | $0 |
| 2024 | $36 | $469,585 | $0 | $0 |
| 2023 | $3,483 | $424,560 | $0 | $0 |
| 2022 | $2,855 | $332,560 | $0 | $0 |
| 2021 | $2,887 | $491,740 | $158,050 | $333,690 |
| 2020 | $2,530 | $398,906 | $158,050 | $240,856 |
| 2019 | $2,650 | $398,906 | $158,050 | $240,856 |
| 2018 | $2,532 | $367,490 | $158,050 | $209,440 |
| 2017 | $2,519 | $207,870 | $0 | $0 |
| 2016 | $2,558 | $185,485 | $0 | $0 |
| 2015 | $1,935 | $156,700 | $0 | $0 |
| 2014 | $1,890 | $156,700 | $0 | $0 |
| 2013 | -- | $156,700 | $0 | $0 |
Source: Public Records
Map
Nearby Homes
- 1100 E 1900 N Unit 10
- 1374 N 1250 E Unit 48
- 1336 E Talmage Ln Unit 38
- 1341 N 1250 E Unit 41
- 1354 N 1250 E Unit 46
- 1238 E Talmage Ln Unit 33
- 1366 N Talmage Ln Unit 35
- 1367 E 1280 N
- 1261 E Talmage Ln Unit 59
- 1241 E Talmage Ln Unit 31
- 1246 E Talmage Ln Unit 32
- 1454 N 1400 E
- 643 E 1280 N
- 648 E 1280 N
- 2168 N 750 E
- 1593 N 110 W Unit 201
- 611 E 2450 N Unit 1
- 1593 N 110 W Unit 202
- 1593 N 110 W Unit 204
- 1200 W 1400 N
Your Personal Tour Guide
Ask me questions while you tour the home.