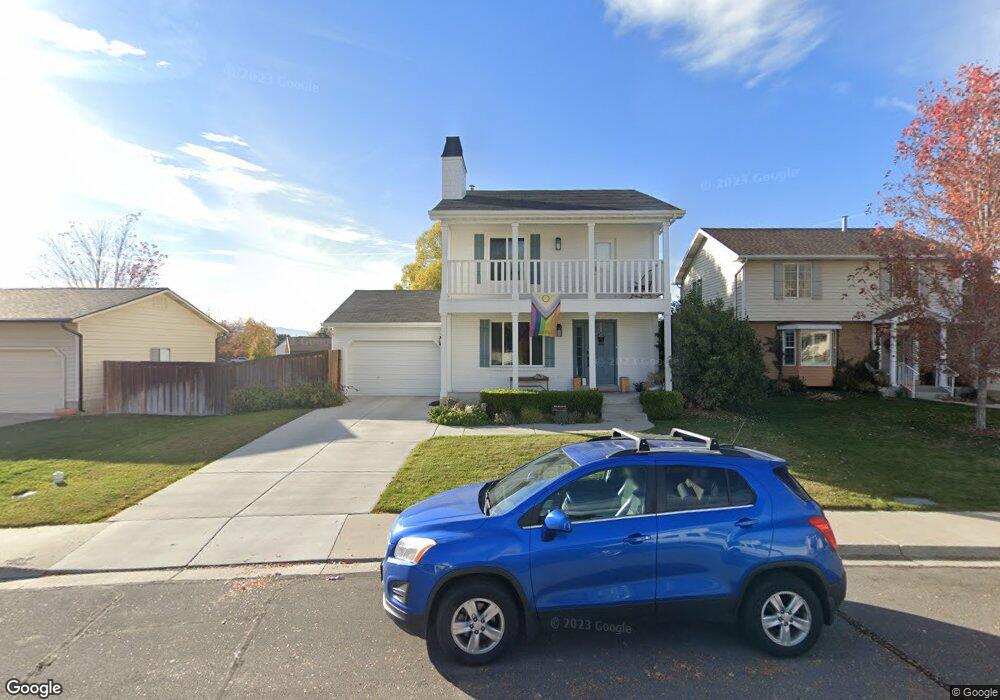
1649 N 110 W Orem, UT 84057
Northridge NeighborhoodEstimated Value: $457,259 - $538,000
3
Beds
2
Baths
1,408
Sq Ft
$360/Sq Ft
Est. Value
About This Home
This home is located at 1649 N 110 W, Orem, UT 84057 and is currently estimated at $506,753, approximately $359 per square foot. 1649 N 110 W is a home located in Utah County with nearby schools including Northridge Elementary School, Oak Canyon Junior High School, and Timpanogos High School.
Ownership History
Date
Name
Owned For
Owner Type
Purchase Details
Closed on
Jul 2, 2019
Sold by
Travassos Brenda
Bought by
Travassos Brenda Almquist and Torschlusspanik Trust
Current Estimated Value
Purchase Details
Closed on
Jun 25, 2013
Sold by
Jessop Kevin and Jessop Dalliene
Bought by
Travassos Brenda
Home Financials for this Owner
Home Financials are based on the most recent Mortgage that was taken out on this home.
Original Mortgage
$207,452
Outstanding Balance
$148,004
Interest Rate
3.48%
Mortgage Type
New Conventional
Estimated Equity
$358,749
Purchase Details
Closed on
Apr 30, 2001
Sold by
Deere Monte M and Deere Barbara F
Bought by
Jessop Kevin and Jessop Dalliene
Home Financials for this Owner
Home Financials are based on the most recent Mortgage that was taken out on this home.
Original Mortgage
$159,784
Interest Rate
6.98%
Mortgage Type
FHA
Create a Home Valuation Report for This Property
The Home Valuation Report is an in-depth analysis detailing your home's value as well as a comparison with similar homes in the area
Home Values in the Area
Average Home Value in this Area
Purchase History
| Date | Buyer | Sale Price | Title Company |
|---|---|---|---|
| Travassos Brenda Almquist | -- | None Available | |
| Travassos Brenda | -- | Pro Title & Escrow | |
| Jessop Kevin | -- | Pro Title & Escrow Inc |
Source: Public Records
Mortgage History
| Date | Status | Borrower | Loan Amount |
|---|---|---|---|
| Open | Travassos Brenda | $207,452 | |
| Previous Owner | Jessop Kevin | $159,784 |
Source: Public Records
Tax History
| Year | Tax Paid | Tax Assessment Tax Assessment Total Assessment is a certain percentage of the fair market value that is determined by local assessors to be the total taxable value of land and additions on the property. | Land | Improvement |
|---|---|---|---|---|
| 2025 | $1,914 | $230,505 | -- | -- |
| 2024 | $1,914 | $234,080 | $0 | $0 |
| 2023 | $1,806 | $237,325 | $0 | $0 |
| 2022 | $1,801 | $229,295 | $0 | $0 |
| 2021 | $1,556 | $300,000 | $139,600 | $160,400 |
| 2020 | $1,419 | $269,000 | $111,700 | $157,300 |
| 2019 | $1,261 | $248,500 | $111,700 | $136,800 |
| 2018 | $1,286 | $242,100 | $105,300 | $136,800 |
| 2017 | $1,146 | $115,610 | $0 | $0 |
| 2016 | $1,196 | $111,210 | $0 | $0 |
| 2015 | $1,252 | $110,110 | $0 | $0 |
| 2014 | $1,131 | $99,055 | $0 | $0 |
Source: Public Records
Map
Nearby Homes
- 87 W 1525 N
- 1547 N 275 West St Unit 5
- 332 W Amiron Way Unit D
- 1461 N Amiron Way Unit D
- 1461 N Amiron Way Unit B
- 193 E 1570 N
- 1545 N State St Unit 1
- 1987 N 400 W
- 442 W 1950 North St
- 363 E 1395 N Unit 22
- 127 S 400 E
- 531 W 1350 N
- 1371 N 330 E Unit 8
- 651 W 1800 N
- 582 W 1300 N
- 686 W 1870 N Unit 12
- 545 W 1240 N
- 1050 N 100 W
- 538 W 1120 N
- 1405 N 770 W
Your Personal Tour Guide
Ask me questions while you tour the home.