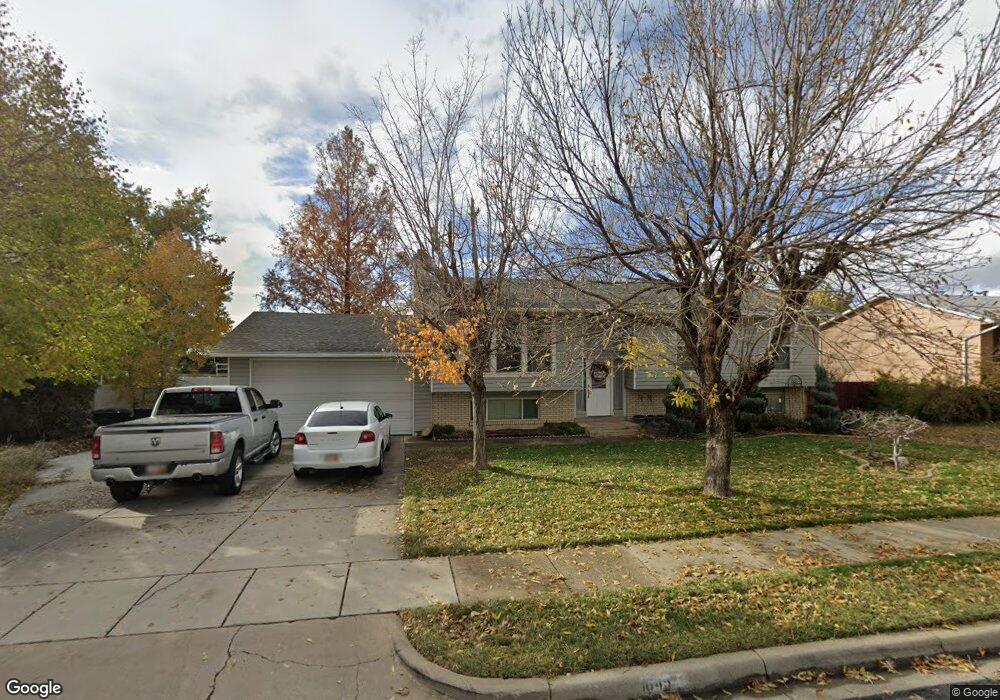
1649 N 725 W West Bountiful, UT 84087
Estimated Value: $489,000 - $515,000
3
Beds
1
Bath
1,138
Sq Ft
$441/Sq Ft
Est. Value
About This Home
This home is located at 1649 N 725 W, West Bountiful, UT 84087 and is currently estimated at $501,859, approximately $441 per square foot. 1649 N 725 W is a home located in Davis County with nearby schools including West Bountiful Elementary School, Bountiful Junior High School, and Viewmont High School.
Ownership History
Date
Name
Owned For
Owner Type
Purchase Details
Closed on
May 24, 2013
Sold by
Sanders Scott
Bought by
Sanders Scott M
Current Estimated Value
Home Financials for this Owner
Home Financials are based on the most recent Mortgage that was taken out on this home.
Original Mortgage
$113,760
Outstanding Balance
$23,592
Interest Rate
2.6%
Mortgage Type
New Conventional
Estimated Equity
$478,267
Purchase Details
Closed on
Feb 16, 1999
Sold by
Batura Cynthia L
Bought by
Sanders Scott
Home Financials for this Owner
Home Financials are based on the most recent Mortgage that was taken out on this home.
Original Mortgage
$128,306
Interest Rate
6.77%
Mortgage Type
FHA
Purchase Details
Closed on
Feb 27, 1998
Sold by
Batura Michael S
Bought by
Batura Cynthia K
Create a Home Valuation Report for This Property
The Home Valuation Report is an in-depth analysis detailing your home's value as well as a comparison with similar homes in the area
Home Values in the Area
Average Home Value in this Area
Purchase History
| Date | Buyer | Sale Price | Title Company |
|---|---|---|---|
| Sanders Scott M | -- | Aspen Title Insuranc | |
| Sanders Scott | -- | Bonneville Title Company Inc | |
| Batura Cynthia K | -- | Backman Stewart Title Servic |
Source: Public Records
Mortgage History
| Date | Status | Borrower | Loan Amount |
|---|---|---|---|
| Open | Sanders Scott M | $113,760 | |
| Closed | Sanders Scott | $128,306 |
Source: Public Records
Tax History Compared to Growth
Tax History
| Year | Tax Paid | Tax Assessment Tax Assessment Total Assessment is a certain percentage of the fair market value that is determined by local assessors to be the total taxable value of land and additions on the property. | Land | Improvement |
|---|---|---|---|---|
| 2025 | $2,898 | $237,600 | $137,503 | $100,097 |
| 2024 | $2,790 | $240,900 | $113,002 | $127,898 |
| 2023 | $2,561 | $423,000 | $214,268 | $208,732 |
| 2022 | $2,576 | $241,451 | $102,383 | $139,068 |
| 2021 | $2,435 | $330,000 | $137,395 | $192,605 |
| 2020 | $2,130 | $278,000 | $128,048 | $149,952 |
| 2019 | $2,029 | $271,000 | $129,651 | $141,349 |
| 2018 | $1,860 | $251,000 | $130,538 | $120,462 |
| 2016 | $1,605 | $114,345 | $33,557 | $80,788 |
| 2015 | $1,556 | $104,555 | $33,557 | $70,998 |
| 2014 | $1,560 | $107,127 | $33,557 | $73,570 |
| 2013 | -- | $98,850 | $28,411 | $70,439 |
Source: Public Records
Map
Nearby Homes