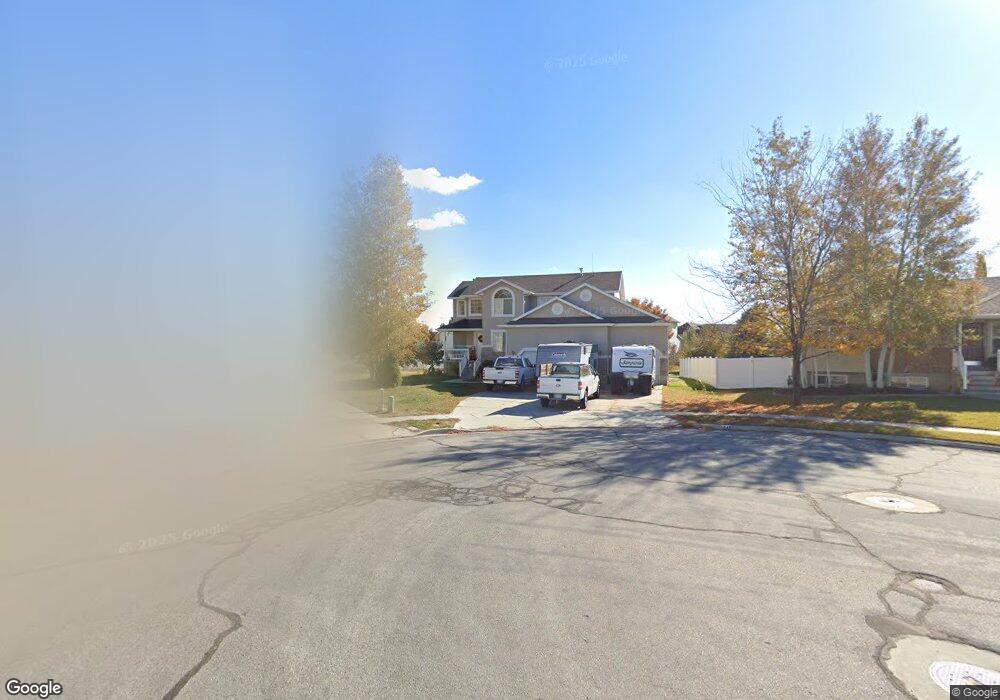
1649 W 2115 S Syracuse, UT 84075
Estimated Value: $555,000 - $600,000
4
Beds
3
Baths
2,224
Sq Ft
$261/Sq Ft
Est. Value
About This Home
This home is located at 1649 W 2115 S, Syracuse, UT 84075 and is currently estimated at $581,418, approximately $261 per square foot. 1649 W 2115 S is a home located in Davis County with nearby schools including Cook School, Syracuse Junior High School, and Syracuse High School.
Ownership History
Date
Name
Owned For
Owner Type
Purchase Details
Closed on
Jun 7, 2021
Sold by
Johnson Michael C
Bought by
Johnson Michael C and Johnson Mary Elizabeth
Current Estimated Value
Purchase Details
Closed on
Jun 13, 2003
Sold by
Mark Higley Construction Lc
Bought by
Johnson Michael C and Johnson Sheila D
Home Financials for this Owner
Home Financials are based on the most recent Mortgage that was taken out on this home.
Original Mortgage
$147,344
Outstanding Balance
$62,824
Interest Rate
5.53%
Mortgage Type
Purchase Money Mortgage
Estimated Equity
$518,594
Purchase Details
Closed on
Jan 24, 2003
Sold by
Rainey Homes Inc
Bought by
Mark Higley Construction Lc
Home Financials for this Owner
Home Financials are based on the most recent Mortgage that was taken out on this home.
Original Mortgage
$146,400
Interest Rate
5.96%
Mortgage Type
Construction
Create a Home Valuation Report for This Property
The Home Valuation Report is an in-depth analysis detailing your home's value as well as a comparison with similar homes in the area
Home Values in the Area
Average Home Value in this Area
Purchase History
| Date | Buyer | Sale Price | Title Company |
|---|---|---|---|
| Johnson Michael C | -- | Stewart Title Ins Age | |
| Johnson Michael C | -- | Heritage West Title Insuranc | |
| Mark Higley Construction Lc | -- | Heritage West Title Insuranc |
Source: Public Records
Mortgage History
| Date | Status | Borrower | Loan Amount |
|---|---|---|---|
| Open | Johnson Michael C | $147,344 | |
| Previous Owner | Mark Higley Construction Lc | $146,400 | |
| Closed | Johnson Michael C | $12,000 |
Source: Public Records
Tax History
| Year | Tax Paid | Tax Assessment Tax Assessment Total Assessment is a certain percentage of the fair market value that is determined by local assessors to be the total taxable value of land and additions on the property. | Land | Improvement |
|---|---|---|---|---|
| 2025 | $3,067 | $295,900 | $134,911 | $160,989 |
| 2024 | $3,063 | $297,550 | $115,200 | $182,350 |
| 2023 | $2,870 | $508,000 | $160,307 | $347,693 |
| 2022 | $3,118 | $302,500 | $91,776 | $210,724 |
| 2021 | $2,803 | $421,000 | $136,041 | $284,959 |
| 2020 | $2,517 | $366,000 | $116,681 | $249,319 |
| 2019 | $2,459 | $353,000 | $116,286 | $236,714 |
| 2018 | $2,281 | $325,000 | $111,101 | $213,899 |
| 2016 | $2,015 | $150,590 | $42,561 | $108,029 |
| 2015 | $1,958 | $139,315 | $42,561 | $96,754 |
| 2014 | $1,880 | $136,335 | $42,561 | $93,774 |
| 2013 | -- | $124,242 | $34,232 | $90,010 |
Source: Public Records
Map
Nearby Homes
- 2001 S 1800 W
- 1876 W 2400 S
- 1294 W 2375 S
- 1284 W 2375 S
- 1283 W 2375 S
- 2423 S 2000 W
- 2366 S 1230 W
- 2071 W 2200 S
- 1857 W 2575 S
- 1782 W 1700 S
- 1196 W 2325 S
- 1478 W 1700 S
- 2621 S 1580 W
- 1134 W 2275 S
- 2138 Craig Ln
- 1543 S Marilyn Dr W
- 1116 W 2325 S
- 1168 W Tivoli Way
- 1643 W 2700 S Unit 216
- 1653 W 2700 S Unit 218
Your Personal Tour Guide
Ask me questions while you tour the home.