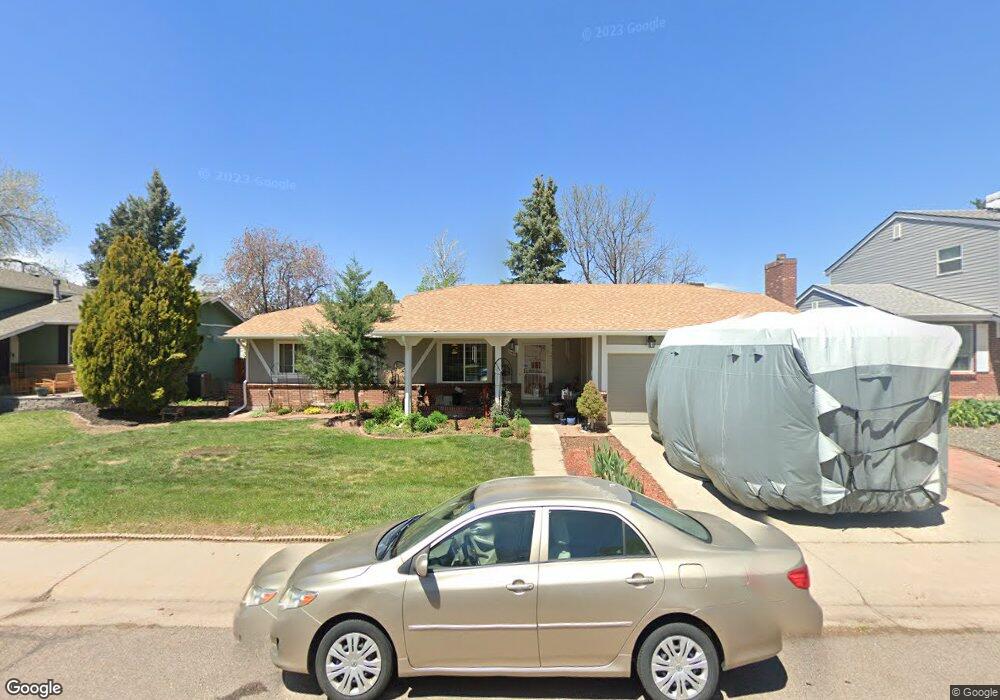
16493 E Stanford Place Aurora, CO 80015
Pheasant Run NeighborhoodEstimated Value: $459,412 - $479,000
3
Beds
5
Baths
1,351
Sq Ft
$348/Sq Ft
Est. Value
About This Home
This home is located at 16493 E Stanford Place, Aurora, CO 80015 and is currently estimated at $470,603, approximately $348 per square foot. 16493 E Stanford Place is a home located in Arapahoe County with nearby schools including Independence Elementary School, Laredo Middle School, and Smoky Hill High School.
Ownership History
Date
Name
Owned For
Owner Type
Purchase Details
Closed on
Sep 20, 2002
Sold by
Barnes Sally Atwood
Bought by
Sieve Jon and Sieve Rebecca J
Current Estimated Value
Home Financials for this Owner
Home Financials are based on the most recent Mortgage that was taken out on this home.
Original Mortgage
$122,000
Interest Rate
6.25%
Purchase Details
Closed on
Oct 25, 1993
Sold by
Barnes Sally A Mcknab
Bought by
Barnes Sally Atwood
Home Financials for this Owner
Home Financials are based on the most recent Mortgage that was taken out on this home.
Original Mortgage
$73,750
Interest Rate
6.96%
Purchase Details
Closed on
Jun 11, 1987
Sold by
Conversion Arapco
Bought by
Barnes Sally A
Purchase Details
Closed on
Dec 1, 1979
Sold by
Conversion Arapco
Bought by
Conversion Arapco
Purchase Details
Closed on
Jul 4, 1776
Bought by
Conversion Arapco
Create a Home Valuation Report for This Property
The Home Valuation Report is an in-depth analysis detailing your home's value as well as a comparison with similar homes in the area
Home Values in the Area
Average Home Value in this Area
Purchase History
| Date | Buyer | Sale Price | Title Company |
|---|---|---|---|
| Sieve Jon | $202,000 | Land Title Guarantee Company | |
| Barnes Sally Atwood | -- | Commonwealth Land Title Ins | |
| Barnes Sally A | -- | -- | |
| Conversion Arapco | -- | -- | |
| Conversion Arapco | -- | -- |
Source: Public Records
Mortgage History
| Date | Status | Borrower | Loan Amount |
|---|---|---|---|
| Closed | Sieve Jon | $122,000 | |
| Previous Owner | Barnes Sally Atwood | $73,750 |
Source: Public Records
Tax History
| Year | Tax Paid | Tax Assessment Tax Assessment Total Assessment is a certain percentage of the fair market value that is determined by local assessors to be the total taxable value of land and additions on the property. | Land | Improvement |
|---|---|---|---|---|
| 2025 | $1,935 | $31,019 | -- | -- |
| 2024 | $1,706 | $31,356 | -- | -- |
| 2023 | $1,706 | $31,356 | $0 | $0 |
| 2022 | $1,346 | $25,535 | $0 | $0 |
| 2021 | $1,861 | $25,535 | $0 | $0 |
| 2020 | $1,620 | $22,559 | $0 | $0 |
| 2019 | $1,563 | $22,559 | $0 | $0 |
| 2018 | $1,604 | $21,751 | $0 | $0 |
| 2017 | $1,581 | $21,751 | $0 | $0 |
| 2016 | $1,397 | $18,029 | $0 | $0 |
| 2015 | $1,329 | $18,029 | $0 | $0 |
| 2014 | $1,152 | $13,834 | $0 | $0 |
| 2013 | -- | $15,010 | $0 | $0 |
Source: Public Records
Map
Nearby Homes
- 16373 E Rice Place Unit B
- 16313 E Rice Place Unit B
- 16482 E Radcliff Place Unit A
- 16222 E Rice Place Unit B
- 16229 E Stanford Place
- 4557 S Laredo St
- 4678 S Lewiston Way
- 15922 E Rice Place Unit B
- 4614 S Kalispell Way
- 16930 E Stanford Ave
- 4229 S Mobile Cir Unit B
- 4221 S Mobile Cir Unit A
- 4784 S Olathe Way
- 4677 S Pagosa Way
- 4612 S Pagosa Cir
- 4512 S Pagosa Cir
- 17042 E Wagon Trail Pkwy
- 4450 S Pitkin St Unit 126
- 4106 S Laredo Way
- 4480 S Pitkin St Unit 128
- 16453 E Stanford Place
- 16396 E Rice Place Unit A
- 16525 E Stanford Place
- 16413 E Stanford Place
- 16506 E Stanford Place
- 16356 E Rice Place Unit B
- 16356 E Rice Place Unit A
- 16386 E Rice Place Unit B
- 16386 E Rice Place Unit A
- 16535 E Stanford Place
- 4575 S Norfolk Way
- 16536 E Stanford Place
- 16428 E Rice Place Unit A
- 16428 E Rice Place Unit B
- 4554 S Mobile Way
- 16403 E Stanford Place
- 16428 E Rice #B Place
- 16366 E Rice Place Unit B
- 16366 E Rice Place Unit A
- 16507 E Tufts Ave
Your Personal Tour Guide
Ask me questions while you tour the home.