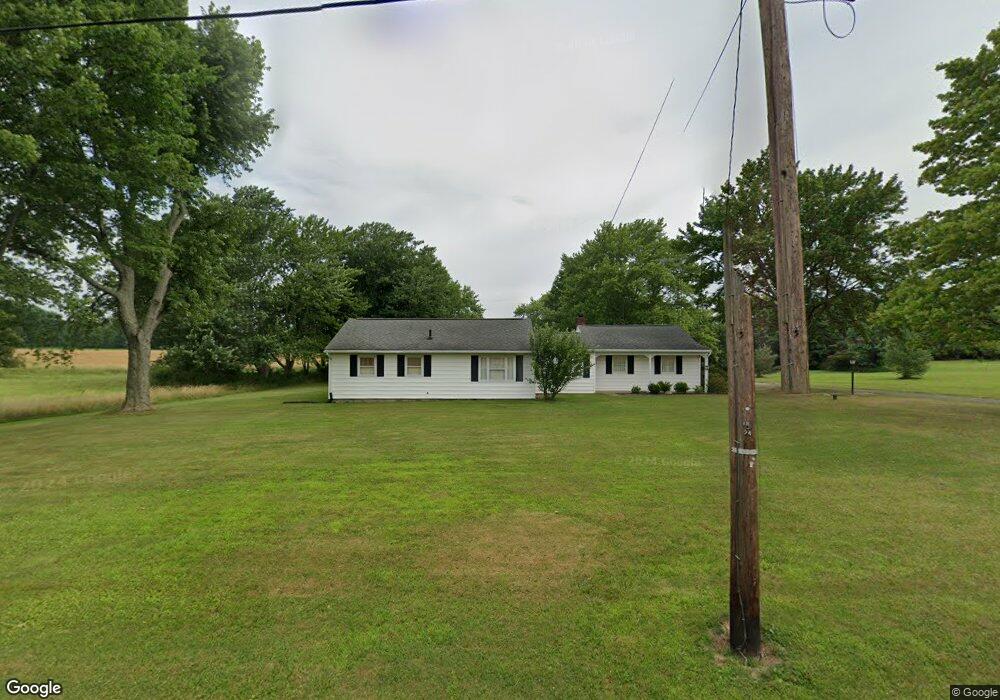
16495 Cenfield St NE Alliance, OH 44601
Estimated Value: $255,811 - $792,000
3
Beds
1
Bath
1,933
Sq Ft
$231/Sq Ft
Est. Value
About This Home
This home is located at 16495 Cenfield St NE, Alliance, OH 44601 and is currently estimated at $446,937, approximately $231 per square foot. 16495 Cenfield St NE is a home located in Stark County with nearby schools including Marlington High School.
Ownership History
Date
Name
Owned For
Owner Type
Purchase Details
Closed on
Jul 10, 2015
Sold by
Reber Brad A and Runion Brenda F
Bought by
Reber Properties Ii Ltd
Current Estimated Value
Purchase Details
Closed on
Dec 23, 2008
Sold by
Reber Fay M
Bought by
Reber Brad A and Runion Brenda F
Purchase Details
Closed on
Dec 22, 2008
Sold by
Reber Properties Ii Ltd
Bought by
Reber Fay M
Purchase Details
Closed on
Mar 28, 2007
Sold by
Reber Allen J and Reber Fay M
Bought by
Reber Allen J and Reber Fay M
Create a Home Valuation Report for This Property
The Home Valuation Report is an in-depth analysis detailing your home's value as well as a comparison with similar homes in the area
Home Values in the Area
Average Home Value in this Area
Purchase History
| Date | Buyer | Sale Price | Title Company |
|---|---|---|---|
| Reber Properties Ii Ltd | -- | Attorney | |
| Reber Brad A | -- | Attorney | |
| Reber Fay M | -- | Attorney | |
| Reber Properties Ii Ltd | -- | Attorney | |
| Reber Allen J | -- | None Available |
Source: Public Records
Tax History Compared to Growth
Tax History
| Year | Tax Paid | Tax Assessment Tax Assessment Total Assessment is a certain percentage of the fair market value that is determined by local assessors to be the total taxable value of land and additions on the property. | Land | Improvement |
|---|---|---|---|---|
| 2025 | -- | $68,435 | $35,985 | $32,450 |
| 2024 | -- | $68,435 | $35,985 | $32,450 |
| 2023 | $1,179 | $53,870 | $26,320 | $27,550 |
| 2022 | $592 | $36,930 | $9,380 | $27,550 |
| 2021 | $1,187 | $36,930 | $9,380 | $27,550 |
| 2020 | $1,259 | $35,070 | $9,170 | $25,900 |
| 2019 | $527 | $35,080 | $9,180 | $25,900 |
| 2018 | $1,252 | $35,080 | $9,180 | $25,900 |
| 2017 | $1,277 | $33,230 | $11,280 | $21,950 |
| 2016 | $1,409 | $37,360 | $11,280 | $26,080 |
| 2015 | $1,053 | $37,360 | $11,280 | $26,080 |
| 2014 | $1,119 | $36,550 | $9,600 | $26,950 |
| 2013 | $560 | $36,550 | $9,600 | $26,950 |
Source: Public Records
Map
Nearby Homes
- 22120 Center Rd
- 16159 Salem Church St NE
- 6378 Union Ave NE
- 6434 Union Ave NE
- 1299 E Bayton St
- 540 E Bayton St
- 5200 Union Ave NE
- 1100 E Bayton St
- 1835 Homeworth Rd
- 22840 Buck Rd
- 3636 S Mahoning Ave
- 3709 S Union Ave
- 22360 Margaret Ln
- 1105 Abbey Ln
- 256 Laramie St
- 277 W Carol St
- 5869 Beechwood Ave
- 555 E Milton St
- 13881 Salem Church St NE
- 3101 Ridgehill Ave
- 16549 Cenfield St NE
- 5944 Mahoning Ave NE
- 5914 Mahoning Ave NE
- 5963 Mahoning Ave NE
- 6115 Mahoning Ave NE
- 6050 Mahoning Ave NE
- 16339 Cenfield St NE
- 22493 Center Rd
- 22074 Center Rd
- 6185 Mahoning Ave NE
- 16285 Cenfield St NE
- 6196 Mahoning Ave NE
- 5786 Mahoning Ave NE
- 5776 Mahoning Ave NE
- 22199 Center Rd
- 22146 Center Rd
- 16227 Cenfield St NE
- 16230 Cenfield St NE
- 22174 Center Rd
- 5744 Mahoning Ave NE