165 Ausburn Rd Blue Ridge, GA 30513
Estimated Value: $299,000 - $810,000
--
Bed
2
Baths
2,904
Sq Ft
$206/Sq Ft
Est. Value
About This Home
This home is located at 165 Ausburn Rd, Blue Ridge, GA 30513 and is currently estimated at $598,667, approximately $206 per square foot. 165 Ausburn Rd is a home located in Fannin County with nearby schools including Fannin County High School.
Ownership History
Date
Name
Owned For
Owner Type
Purchase Details
Closed on
Jan 18, 2022
Sold by
Kinman Tammy
Bought by
Ritchie William Hoke and Ritchie Catherine A
Current Estimated Value
Purchase Details
Closed on
Sep 4, 2018
Sold by
Kinman Tammy
Bought by
Ritchie William Hoke and Ritchie Catherine A
Purchase Details
Closed on
Nov 7, 2014
Sold by
Ausburn Pauline Davenport
Bought by
Ritchie William Hoke and Ritchie Catherine A
Purchase Details
Closed on
Dec 18, 2008
Sold by
Kinman Tammy Lynn
Bought by
Kinman Pauline D
Home Financials for this Owner
Home Financials are based on the most recent Mortgage that was taken out on this home.
Original Mortgage
$26,218
Interest Rate
5.96%
Mortgage Type
New Conventional
Purchase Details
Closed on
Apr 15, 2008
Sold by
Ausburn Pauline
Bought by
Graham Thomas
Purchase Details
Closed on
Mar 9, 2008
Sold by
Ausburn Roy
Bought by
Kinman Tammy and Kinman David
Purchase Details
Closed on
May 24, 2001
Sold by
Ausburn W R
Bought by
Ausburn Ausburn W and Ausburn Paul
Create a Home Valuation Report for This Property
The Home Valuation Report is an in-depth analysis detailing your home's value as well as a comparison with similar homes in the area
Home Values in the Area
Average Home Value in this Area
Purchase History
| Date | Buyer | Sale Price | Title Company |
|---|---|---|---|
| Ritchie William Hoke | $58,520 | -- | |
| Ritchie William Hoke | $91,000 | -- | |
| Ritchie William Hoke | $136,800 | -- | |
| Kinman Tammy | $100,000 | -- | |
| Kinman Pauline D | -- | -- | |
| Graham Thomas | -- | -- | |
| Graham Thomas | -- | -- | |
| Kinman Tammy | -- | -- | |
| Ausburn Ausburn W | -- | -- |
Source: Public Records
Mortgage History
| Date | Status | Borrower | Loan Amount |
|---|---|---|---|
| Previous Owner | Graham Thomas | $26,218 |
Source: Public Records
Tax History Compared to Growth
Tax History
| Year | Tax Paid | Tax Assessment Tax Assessment Total Assessment is a certain percentage of the fair market value that is determined by local assessors to be the total taxable value of land and additions on the property. | Land | Improvement |
|---|---|---|---|---|
| 2024 | $1,287 | $140,427 | $43,973 | $96,454 |
| 2023 | $1,265 | $124,055 | $43,973 | $80,082 |
| 2022 | $1,276 | $125,202 | $43,973 | $81,229 |
| 2021 | $993 | $83,140 | $27,606 | $55,534 |
| 2020 | $1,014 | $83,140 | $27,606 | $55,534 |
| 2019 | $1,039 | $83,140 | $27,606 | $55,534 |
| 2018 | $1,090 | $99,642 | $44,108 | $55,534 |
| 2017 | $1,777 | $100,440 | $44,108 | $56,332 |
| 2016 | $805 | $81,183 | $44,108 | $37,075 |
| 2015 | -- | $77,382 | $44,108 | $33,274 |
| 2013 | -- | $0 | $0 | $0 |
Source: Public Records
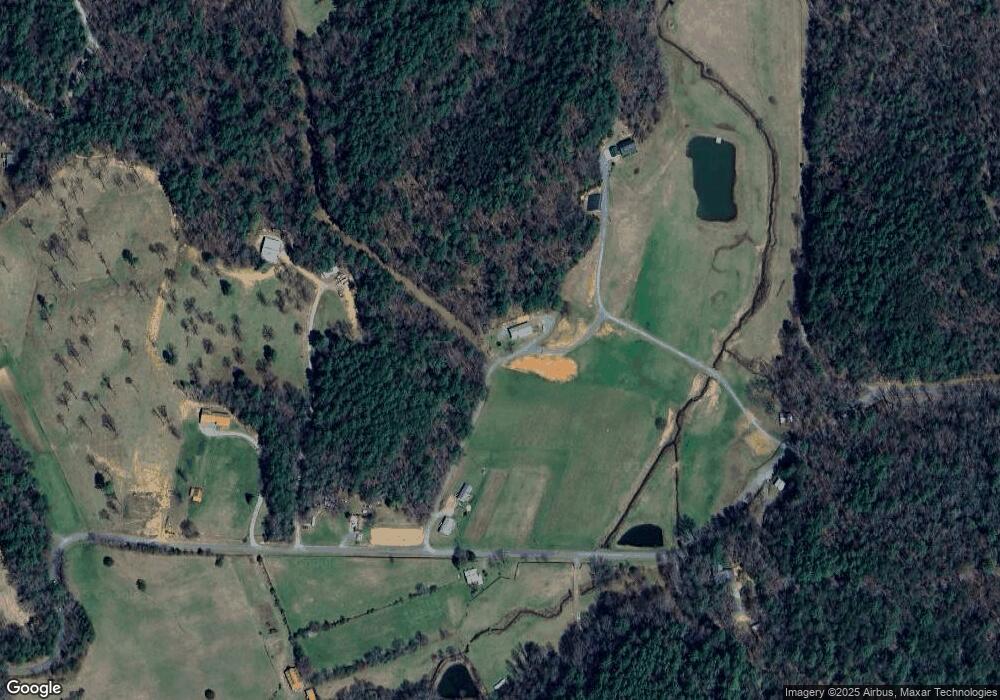
Map
Nearby Homes
- 769 Higdon Creek Rd
- 416 Mill Stone Mountain Ln
- 136 Pack Creek Rd
- 879 Mill Stone Mountain Ln
- 136 Oasis Dr
- 399 Pack Creek Rd
- 739 Big Sky Trail
- 226 Pinetree Dr
- 463 Big Sky Trail Unit 15,16,17
- 463 Big Sky Trail
- 0 Cottonwood Ln
- 225 Cohutta Ranch Rd
- 200 Dancing Leaves Trail
- 7590 Mobile Rd
- 6460 Highway 2
- 400 Cloudland Trace
- 126 Walter Mountain Dr
- 550 Watson Rd
- 270 Ausburn Rd
- 270 Ausburn Rd
- 721 Higdon Creek Rd
- 405 Higdon Creek Rd
- 2 AC Ritchie Creek Rd Unit 2
- 2 AC Ritchie Creek Rd
- TR B Ritchie Creek Rd
- 0 Ritchie Creek Rd
- 00 Ritchie Creek Rd
- 512 Ritchie Creek Rd
- 1755 Ritchie Creek Rd
- 983 Ritchie Creek Rd
- 1454 Ritchie Creek Rd
- 2015 Ritchie Creek Rd
- 2100 Ritchie Creek Rd
- 191 Higdon Creek Rd
- 1466 Ritchie Creek Rd
- 2160 Ritchie Creek Rd
- 207 Higdon Creek Rd
- 0 Higdon Creek Rd Unit 311133