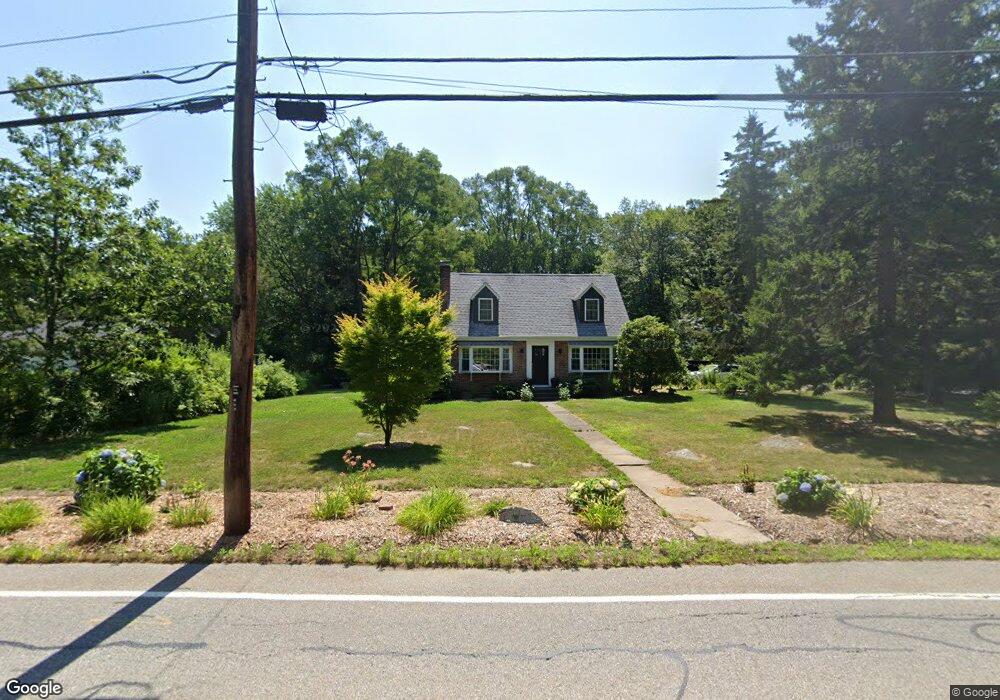
165 Bedford Rd Unit SF Lincoln, MA 01773
Estimated Value: $906,335 - $1,107,000
3
Beds
2
Baths
1,322
Sq Ft
$756/Sq Ft
Est. Value
About This Home
This home is located at 165 Bedford Rd Unit SF, Lincoln, MA 01773 and is currently estimated at $999,584, approximately $756 per square foot. 165 Bedford Rd Unit SF is a home located in Middlesex County with nearby schools including Lincoln-Sudbury Regional High School, Tremont School, and Concord Academy.
Ownership History
Date
Name
Owned For
Owner Type
Purchase Details
Closed on
Jan 31, 2023
Sold by
Colleen Fong Ret2017 and Colleen Fong
Bought by
Briere Lauren C
Current Estimated Value
Home Financials for this Owner
Home Financials are based on the most recent Mortgage that was taken out on this home.
Original Mortgage
$405,000
Outstanding Balance
$391,351
Interest Rate
6.31%
Mortgage Type
Purchase Money Mortgage
Estimated Equity
$608,233
Purchase Details
Closed on
May 1, 2017
Sold by
Fong Peggy and Fong Colleen
Bought by
Colleen Fong Ret 2017 and Fong
Purchase Details
Closed on
Oct 21, 2016
Sold by
Daniels Dennis J and Daniels Earl F
Bought by
Fong Peggy and Fong Colleen
Purchase Details
Closed on
Oct 17, 2014
Sold by
Daniels Claire M
Bought by
Daniels Earl F and Daniels Dennis J
Create a Home Valuation Report for This Property
The Home Valuation Report is an in-depth analysis detailing your home's value as well as a comparison with similar homes in the area
Home Values in the Area
Average Home Value in this Area
Purchase History
| Date | Buyer | Sale Price | Title Company |
|---|---|---|---|
| Briere Lauren C | $763,000 | None Available | |
| Colleen Fong Ret 2017 | -- | -- | |
| Fong Peggy | $550,000 | -- | |
| Daniels Earl F | -- | -- | |
| Daniels Earl F | -- | -- |
Source: Public Records
Mortgage History
| Date | Status | Borrower | Loan Amount |
|---|---|---|---|
| Open | Briere Lauren C | $405,000 | |
| Previous Owner | Daniels Earl F | $70,000 | |
| Previous Owner | Daniels Earl F | $50,000 | |
| Previous Owner | Daniels Earl F | $20,000 |
Source: Public Records
Tax History Compared to Growth
Tax History
| Year | Tax Paid | Tax Assessment Tax Assessment Total Assessment is a certain percentage of the fair market value that is determined by local assessors to be the total taxable value of land and additions on the property. | Land | Improvement |
|---|---|---|---|---|
| 2025 | $107 | $831,900 | $621,500 | $210,400 |
| 2024 | $10,549 | $818,400 | $609,300 | $209,100 |
| 2023 | $10,514 | $755,300 | $573,500 | $181,800 |
| 2022 | $10,193 | $682,700 | $519,700 | $163,000 |
| 2021 | $9,321 | $600,600 | $448,000 | $152,600 |
| 2020 | $9,076 | $590,900 | $455,200 | $135,700 |
| 2019 | $8,024 | $571,900 | $440,100 | $131,800 |
| 2018 | $7,778 | $571,900 | $440,100 | $131,800 |
| 2017 | $7,623 | $556,400 | $427,200 | $129,200 |
| 2016 | $7,784 | $556,400 | $427,200 | $129,200 |
| 2015 | $6,877 | $486,000 | $362,000 | $124,000 |
| 2014 | $6,447 | $447,400 | $324,700 | $122,700 |
Source: Public Records
Map
Nearby Homes
- 29 S Commons Unit D
- 36 Indian Camp Ln Unit D
- 5 South Commons Unit D
- 16 Old Cambridge Turnpike
- 22 Old Cambridge Turnpike
- 10 Reiling Pond Rd
- 241 Shadyside Ave
- 84 Davison Dr
- 69 Page Rd
- 9 Garland Rd
- 646 Cambridge Turnpike
- 22 Lincoln Rd
- 8 Stratford Way
- 2663 Massachusetts Ave
- 6 Revolutionary Rd
- 671 Marrett Rd
- 5 Leroy Rd
- 50 School St
- 30 Harbell St
- 60 Baker Bridge Rd
- 165 Bedford Rd
- 166 Bedford Rd
- 166 Bedford Rd Unit 1
- 161 Bedford Rd
- 167 Bedford Rd
- 168 Bedford Rd
- 162 Bedford Rd
- 169 Bedford Rd
- 159 Bedford Rd
- 160 Bedford Rd
- 173 Bedford Rd
- 157 Bedford Rd
- 158 Bedford Rd
- 10 Silver Birch Ln
- 153 Bedford Rd
- 154 Bedford Rd
- 17 Bedford Ln
- 9 Bedford Ln
- 176 Bedford Rd
- 177 Bedford Rd