
Seller's Agent in 2014
Suzanne Ranieri
Coldwell Banker Realty - Franklin
(508) 380-1643
50 in this area
120 Total Sales
Estimated Value: $471,161 - $573,000
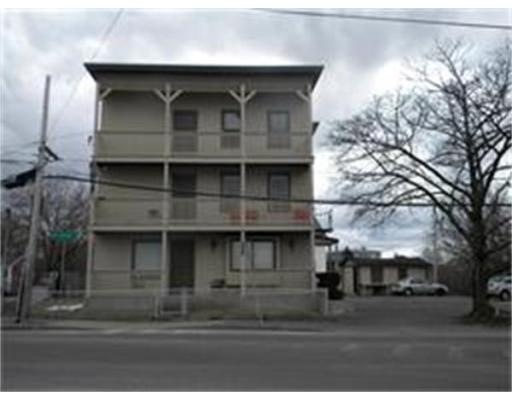
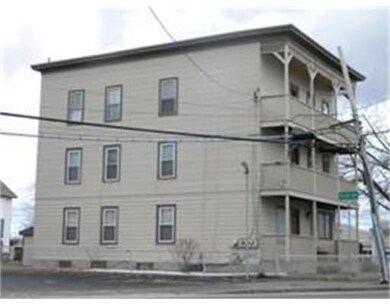
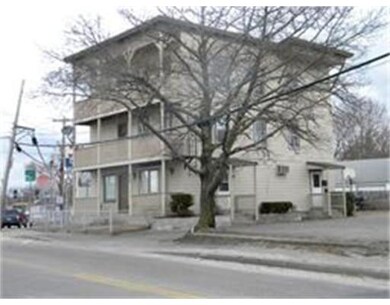
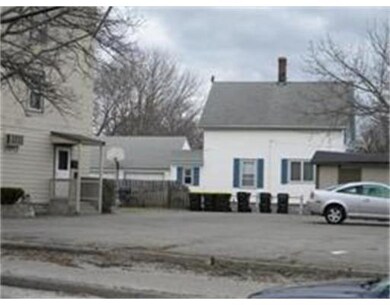
Spacious 3 family, zoned commercial, perfect for in home business. Large apartments and rooms with seperate utilities. Lots of parking. Replacement windows, roof about 8 years old. Fully rented, a real money maker.
Last Agent to Sell the Property
Coldwell Banker Realty - Franklin Listed on: 05/25/2014
Home Type
Multi-Family
Est. Annual Taxes
$4,420
Year Built
1900
Lot Details
0
| Date | Event | Price | List to Sale | Price per Sq Ft |
|---|---|---|---|---|
| 07/07/2014 07/07/14 | Sold | $232,000 | +0.9% | $64 / Sq Ft |
| 06/07/2014 06/07/14 | Pending | -- | -- | -- |
| 05/25/2014 05/25/14 | For Sale | $230,000 | -- | $64 / Sq Ft |
| Year | Tax Paid | Tax Assessment Tax Assessment Total Assessment is a certain percentage of the fair market value that is determined by local assessors to be the total taxable value of land and additions on the property. | Land | Improvement |
|---|---|---|---|---|
| 2025 | $4,420 | $351,900 | $124,700 | $227,200 |
| 2024 | $4,083 | $317,500 | $113,900 | $203,600 |
| 2023 | $4,076 | $312,300 | $108,500 | $203,800 |
| 2022 | $3,897 | $276,800 | $90,500 | $186,300 |
| 2021 | $3,771 | $261,700 | $90,500 | $171,200 |
| 2020 | $3,551 | $249,700 | $85,900 | $163,800 |
| 2019 | $3,301 | $232,300 | $85,900 | $146,400 |
| 2018 | $3,350 | $232,500 | $83,600 | $148,900 |
| 2017 | $3,290 | $229,400 | $83,600 | $145,800 |
| 2016 | $3,281 | $229,600 | $85,800 | $143,800 |
| 2015 | $3,639 | $255,400 | $87,500 | $167,900 |
| 2014 | $3,888 | $265,200 | $92,100 | $173,100 |
Seller's Agent in 2014
Suzanne Ranieri
Coldwell Banker Realty - Franklin
(508) 380-1643
50 in this area
120 Total Sales
Buyer's Agent in 2014
Lisa Paulette
Coldwell Banker Realty - Framingham
(617) 967-5890
8 in this area
124 Total Sales
Source: MLS Property Information Network (MLS PIN)
MLS Number: 71686790
APN: BELL-000098-000143
Disclaimer: Certain information contained herein is derived from information provided by parties other than Homes.com. All information provided is deemed reliable, but is not guaranteed to be accurate and should be independently verified.
![]() The property listing data and information, or the Images, set forth herein were provided to MLS Property Information Network, Inc. from third party sources, including sellers, lessors and public records, and were compiled by MLS Property Information Network, Inc. The property listing data and information, and the Images, are for the personal, non-commercial use of consumers having a good faith interest in purchasing or leasing listed properties of the type displayed to them and may not be used for any purpose other than to identify prospective properties which such consumers may have a good faith interest in purchasing or leasing. MLS Property Information Network, Inc. and its subscribers disclaim any and all representations and warranties as to the accuracy of the property listing data and information, or as to the accuracy of any of the Images, set forth herein.
The property listing data and information, or the Images, set forth herein were provided to MLS Property Information Network, Inc. from third party sources, including sellers, lessors and public records, and were compiled by MLS Property Information Network, Inc. The property listing data and information, and the Images, are for the personal, non-commercial use of consumers having a good faith interest in purchasing or leasing listed properties of the type displayed to them and may not be used for any purpose other than to identify prospective properties which such consumers may have a good faith interest in purchasing or leasing. MLS Property Information Network, Inc. and its subscribers disclaim any and all representations and warranties as to the accuracy of the property listing data and information, or as to the accuracy of any of the Images, set forth herein.