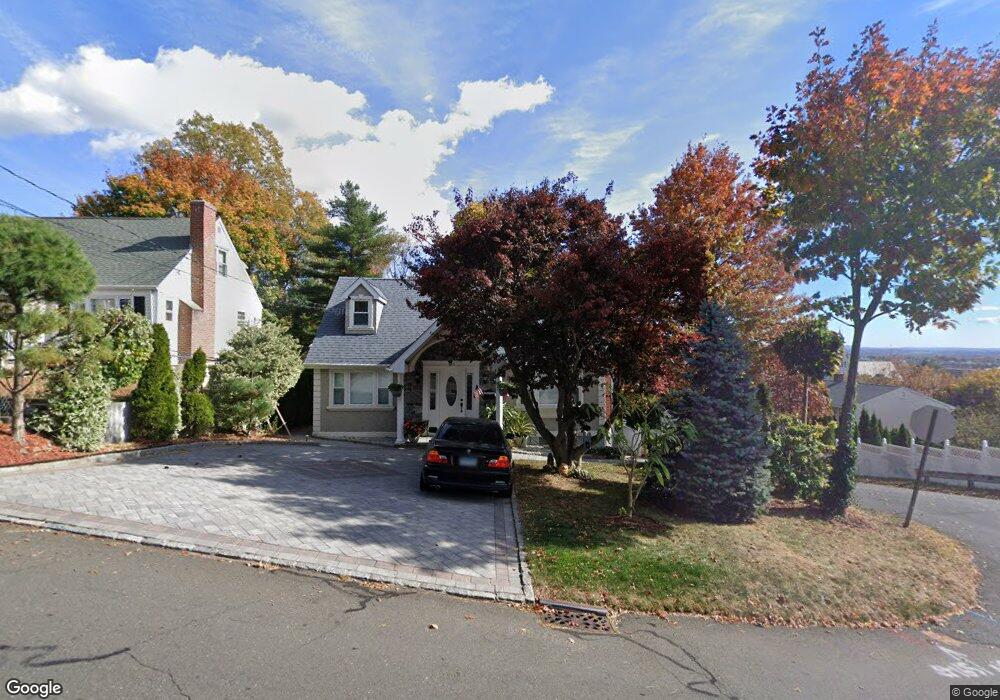
165 Booth St New Britain, CT 06053
Estimated Value: $296,795 - $327,000
4
Beds
2
Baths
1,581
Sq Ft
$193/Sq Ft
Est. Value
About This Home
This home is located at 165 Booth St, New Britain, CT 06053 and is currently estimated at $305,699, approximately $193 per square foot. 165 Booth St is a home located in Hartford County with nearby schools including Lincoln School, Pulaski Middle School, and Mountain Laurel Sudbury School.
Ownership History
Date
Name
Owned For
Owner Type
Purchase Details
Closed on
May 16, 2008
Sold by
Aurora Loan Services L
Bought by
Przybytek Lidia and Kaczmarczyk Dorota
Current Estimated Value
Purchase Details
Closed on
Aug 25, 1992
Sold by
Casella Richard A and Casella Dolores K
Bought by
Untiet Peter J and Untiet Barbara Jane
Home Financials for this Owner
Home Financials are based on the most recent Mortgage that was taken out on this home.
Original Mortgage
$72,000
Interest Rate
8.12%
Mortgage Type
Unknown
Create a Home Valuation Report for This Property
The Home Valuation Report is an in-depth analysis detailing your home's value as well as a comparison with similar homes in the area
Home Values in the Area
Average Home Value in this Area
Purchase History
| Date | Buyer | Sale Price | Title Company |
|---|---|---|---|
| Przybytek Lidia | $112,000 | -- | |
| Untiet Peter J | $82,000 | -- |
Source: Public Records
Mortgage History
| Date | Status | Borrower | Loan Amount |
|---|---|---|---|
| Previous Owner | Untiet Peter J | $144,650 | |
| Previous Owner | Untiet Peter J | $19,281 | |
| Previous Owner | Untiet Peter J | $72,000 |
Source: Public Records
Tax History
| Year | Tax Paid | Tax Assessment Tax Assessment Total Assessment is a certain percentage of the fair market value that is determined by local assessors to be the total taxable value of land and additions on the property. | Land | Improvement |
|---|---|---|---|---|
| 2025 | $5,532 | $141,190 | $51,870 | $89,320 |
| 2024 | $5,590 | $141,190 | $51,870 | $89,320 |
| 2023 | $5,405 | $141,190 | $51,870 | $89,320 |
| 2022 | $5,017 | $101,360 | $23,940 | $77,420 |
| 2021 | $5,017 | $101,360 | $23,940 | $77,420 |
| 2020 | $5,119 | $101,360 | $23,940 | $77,420 |
| 2019 | $5,119 | $101,360 | $23,940 | $77,420 |
| 2018 | $5,119 | $101,360 | $23,940 | $77,420 |
| 2017 | $4,670 | $92,470 | $21,770 | $70,700 |
| 2016 | $4,532 | $89,740 | $21,770 | $67,970 |
| 2015 | $4,397 | $89,740 | $21,770 | $67,970 |
| 2014 | $4,397 | $89,740 | $21,770 | $67,970 |
Source: Public Records
Map
Nearby Homes
Your Personal Tour Guide
Ask me questions while you tour the home.