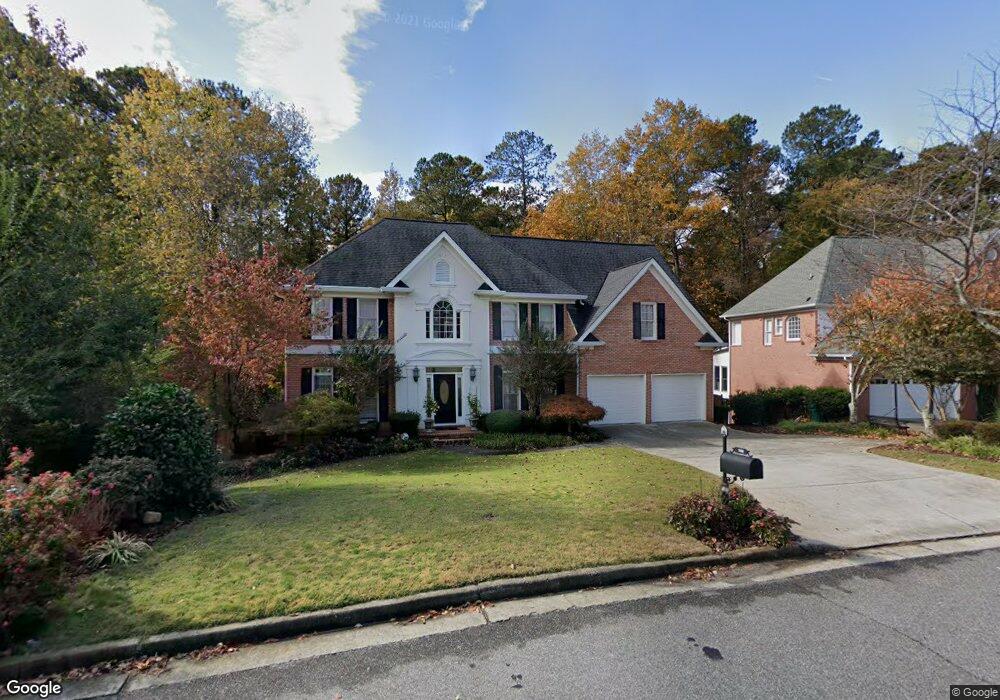
165 Brightmore Way Unit 3C Alpharetta, GA 30005
Seven Oaks NeighborhoodEstimated Value: $861,000 - $962,000
5
Beds
4
Baths
3,054
Sq Ft
$298/Sq Ft
Est. Value
About This Home
This home is located at 165 Brightmore Way Unit 3C, Alpharetta, GA 30005 and is currently estimated at $909,698, approximately $297 per square foot. 165 Brightmore Way Unit 3C is a home located in Fulton County with nearby schools including River Trail Middle School, Northview High School, and McGinnis Woods School.
Ownership History
Date
Name
Owned For
Owner Type
Purchase Details
Closed on
Aug 19, 2004
Sold by
Kessling Norman P and Kessling Barbara
Bought by
Herson John J and Herson Debra
Current Estimated Value
Home Financials for this Owner
Home Financials are based on the most recent Mortgage that was taken out on this home.
Original Mortgage
$332,000
Outstanding Balance
$155,051
Interest Rate
5.13%
Mortgage Type
New Conventional
Estimated Equity
$754,647
Purchase Details
Closed on
Aug 10, 2000
Sold by
Trusis Richard J and Trusis Pamela F
Bought by
Kessling Norman P
Home Financials for this Owner
Home Financials are based on the most recent Mortgage that was taken out on this home.
Original Mortgage
$7,500
Interest Rate
8.23%
Mortgage Type
New Conventional
Purchase Details
Closed on
Nov 21, 1995
Sold by
Hogan Jim Homes Inc
Bought by
Trusis Richard J Pamela F
Create a Home Valuation Report for This Property
The Home Valuation Report is an in-depth analysis detailing your home's value as well as a comparison with similar homes in the area
Home Values in the Area
Average Home Value in this Area
Purchase History
| Date | Buyer | Sale Price | Title Company |
|---|---|---|---|
| Herson John J | $487,000 | -- | |
| Kessling Norman P | $397,000 | -- | |
| Trusis Richard J Pamela F | $290,900 | -- |
Source: Public Records
Mortgage History
| Date | Status | Borrower | Loan Amount |
|---|---|---|---|
| Open | Herson John J | $332,000 | |
| Previous Owner | Kessling Norman P | $7,500 | |
| Closed | Trusis Richard J Pamela F | $0 |
Source: Public Records
Tax History Compared to Growth
Tax History
| Year | Tax Paid | Tax Assessment Tax Assessment Total Assessment is a certain percentage of the fair market value that is determined by local assessors to be the total taxable value of land and additions on the property. | Land | Improvement |
|---|---|---|---|---|
| 2025 | $6,277 | $321,280 | $67,760 | $253,520 |
| 2023 | $6,277 | $321,280 | $67,760 | $253,520 |
| 2022 | $6,167 | $259,080 | $50,640 | $208,440 |
| 2021 | $6,219 | $209,280 | $46,640 | $162,640 |
| 2020 | $5,534 | $186,440 | $33,240 | $153,200 |
| 2019 | $666 | $208,680 | $63,880 | $144,800 |
| 2018 | $5,964 | $198,600 | $62,400 | $136,200 |
| 2017 | $5,451 | $172,320 | $54,120 | $118,200 |
| 2016 | $5,359 | $172,320 | $54,120 | $118,200 |
| 2015 | $5,408 | $171,960 | $54,120 | $117,840 |
| 2014 | $4,888 | $151,640 | $47,720 | $103,920 |
Source: Public Records
Map
Nearby Homes
- 7105 Brookwood Way
- 5735 Sunset Maple Dr
- 110 W Meadows Ct
- 5650 Preserve Cir
- 7170 Collingsworth Place
- 680 Evening Pine Ln
- 7530 Newstead Dr
- 640 Evening Pine Ln
- 7335 Lytham Trace
- 140 Ashewoode Downs Ln
- 5635 Ashewoode Downs Dr
- 5455 Woodrun Ln
- 3585 Lakeheath Dr
- 5440 Vicarage Walk
- 3715 Lakeheath Dr
- 3730 Lakeheath Dr
- 155 Brightmore Way
- 175 Brightmore Way Unit 3C
- 185 Brightmore Way
- 145 Brightmore Way
- 525 Brightmore Downs
- 140 Brightmore Way
- 535 Brightmore Downs
- 515 Brightmore Downs
- 545 Brightmore Downs
- 150 Brightmore Way
- 555 Brightmore Downs Unit 3A
- 130 Brightmore Way
- 195 Brightmore Way
- 135 Brightmore Way
- 160 Brightmore Way
- 505 Brightmore Downs Unit 3A
- 565 Brightmore Downs Unit 3A
- 125 Brightmore Way
- 495 Brightmore Downs Unit 3A
- 315 Tree Lake Ct Unit 3C