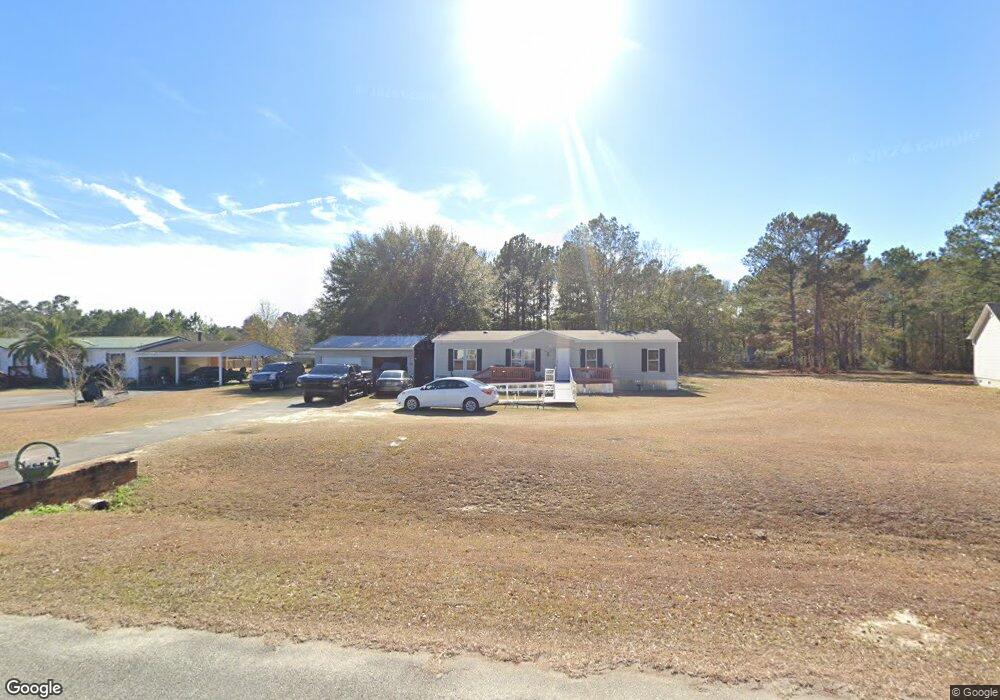
165 Brookwood Chase Thomasville, GA 31757
Estimated Value: $63,927 - $395,000
3
Beds
2
Baths
1,440
Sq Ft
$143/Sq Ft
Est. Value
About This Home
This home is located at 165 Brookwood Chase, Thomasville, GA 31757 and is currently estimated at $205,232, approximately $142 per square foot. 165 Brookwood Chase is a home located in Thomas County with nearby schools including Hand in Hand Primary School, Cross Creek Elementary School, and Garrison-Pilcher Elementary School.
Ownership History
Date
Name
Owned For
Owner Type
Purchase Details
Closed on
Apr 16, 2010
Sold by
Fletcher Richard Lee and Fletcher Jan E
Bought by
Scott Mary and Scott Xavier B L E
Current Estimated Value
Purchase Details
Closed on
May 18, 2006
Sold by
Fletcher Richard Lee
Bought by
Fletcher Richard Lee and Fletcher Jan E
Purchase Details
Closed on
Feb 24, 2006
Sold by
Temple Terrace Homes Inc
Bought by
Fletcher Richard Lee and Fletcher Jan E
Home Financials for this Owner
Home Financials are based on the most recent Mortgage that was taken out on this home.
Original Mortgage
$44,000
Interest Rate
6.05%
Mortgage Type
New Conventional
Purchase Details
Closed on
Jan 12, 2004
Sold by
A & D Distributors Inc
Bought by
Temple Terrace Homes Inc
Purchase Details
Closed on
Aug 14, 2002
Sold by
Bpwp Investments
Bought by
A & D Distributors Inc
Purchase Details
Closed on
Jul 31, 1997
Bought by
Bpwp Investments
Create a Home Valuation Report for This Property
The Home Valuation Report is an in-depth analysis detailing your home's value as well as a comparison with similar homes in the area
Home Values in the Area
Average Home Value in this Area
Purchase History
| Date | Buyer | Sale Price | Title Company |
|---|---|---|---|
| Scott Mary | $87,500 | -- | |
| Fletcher Richard Lee | -- | -- | |
| Fletcher Richard Lee | $55,000 | -- | |
| Temple Terrace Homes Inc | $535,000 | -- | |
| A & D Distributors Inc | $390,000 | -- | |
| Bpwp Investments | -- | -- |
Source: Public Records
Mortgage History
| Date | Status | Borrower | Loan Amount |
|---|---|---|---|
| Previous Owner | Fletcher Richard Lee | $44,000 |
Source: Public Records
Tax History Compared to Growth
Tax History
| Year | Tax Paid | Tax Assessment Tax Assessment Total Assessment is a certain percentage of the fair market value that is determined by local assessors to be the total taxable value of land and additions on the property. | Land | Improvement |
|---|---|---|---|---|
| 2024 | $233 | $11,313 | $10,120 | $1,193 |
| 2023 | $207 | $10,288 | $9,200 | $1,088 |
| 2022 | $389 | $19,179 | $8,000 | $11,179 |
| 2021 | $419 | $18,789 | $8,000 | $10,789 |
| 2020 | $432 | $18,876 | $8,000 | $10,876 |
| 2019 | $449 | $19,375 | $8,000 | $11,375 |
| 2018 | $479 | $20,174 | $8,000 | $12,174 |
| 2017 | $497 | $20,561 | $7,120 | $13,441 |
| 2016 | $537 | $21,946 | $7,120 | $14,826 |
| 2015 | $548 | $22,062 | $6,640 | $15,422 |
| 2014 | $569 | $22,743 | $6,640 | $16,103 |
| 2013 | -- | $24,157 | $6,640 | $17,517 |
Source: Public Records
Map
Nearby Homes
- 113 Lost Creek Ln
- 125 Lost Creek Ln
- 13310 N Us Hwy 319
- 148 Cypress Ln
- 0000 Sanford Road (47 83 Acres)
- 107 Andee Way
- 220 Dillon Rd (28 Acres)
- 220 Dillon Rd
- 221 Ginger Ln
- 100 Sweetbriar Lakes Dr
- 101 Sweetbriar Lakes Dr
- 102 Palm Island Dr
- 104 Palm Island Dr
- 120 Kelon Dr
- 108 Palm Island Dr
- 108 Kelon Dr
- 110 Palm Island Dr
- 109 Jordan Dr
- 115 Jordan Dr
- 12112 Us Highway 319 N
- 149 Brookwood Chase
- 171 Brookwood Chase
- 127 Brookwood Chase
- 164 Brookwood Chase
- 122 Brookwood Chase
- 195 Brookwood Chase
- 105 Brookwood Chase
- 179 Brookwood Chase
- 146 Pine Way
- 122 Rolling Way
- 211 Brookwood Chase
- 108 Rolling Way
- 133 Pine Ln
- 165 Pine Way
- 90 Rolling Way
- 121 Pine Ln
- 59 Brookwood Chase
- 74 Rolling Way
- 115 Pine Way
- 88 Pine Ln