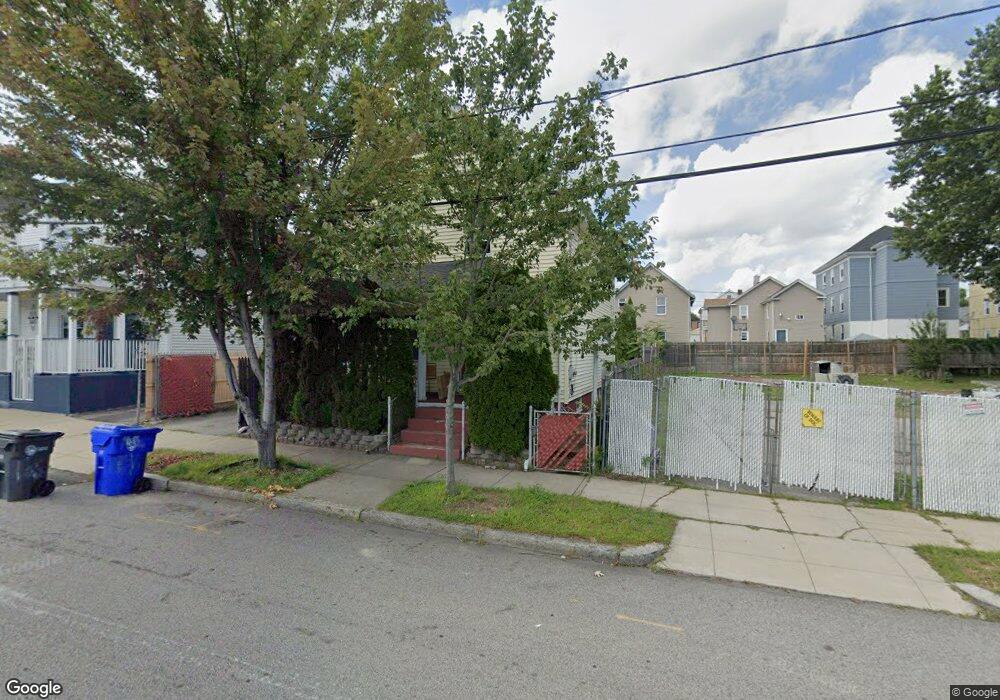
165 Byfield St Providence, RI 02905
Lower South Providence NeighborhoodEstimated Value: $292,000 - $428,000
4
Beds
1
Bath
1,260
Sq Ft
$283/Sq Ft
Est. Value
About This Home
This home is located at 165 Byfield St, Providence, RI 02905 and is currently estimated at $356,045, approximately $282 per square foot. 165 Byfield St is a home located in Providence County with nearby schools including Asa Messer Elementary School, Charles N. Fortes Elementary School, and Alan Shawn Feinstein Elementary.
Ownership History
Date
Name
Owned For
Owner Type
Purchase Details
Closed on
Nov 20, 2002
Sold by
Johnson Shirley
Bought by
Kazeem Muyibat
Current Estimated Value
Home Financials for this Owner
Home Financials are based on the most recent Mortgage that was taken out on this home.
Original Mortgage
$91,655
Outstanding Balance
$38,531
Interest Rate
6.07%
Estimated Equity
$317,514
Create a Home Valuation Report for This Property
The Home Valuation Report is an in-depth analysis detailing your home's value as well as a comparison with similar homes in the area
Home Values in the Area
Average Home Value in this Area
Purchase History
| Date | Buyer | Sale Price | Title Company |
|---|---|---|---|
| Kazeem Muyibat | $94,500 | -- |
Source: Public Records
Mortgage History
| Date | Status | Borrower | Loan Amount |
|---|---|---|---|
| Open | Kazeem Muyibat | $60,000 | |
| Open | Kazeem Muyibat | $91,655 | |
| Closed | Kazeem Muyibat | $2,500 |
Source: Public Records
Tax History Compared to Growth
Tax History
| Year | Tax Paid | Tax Assessment Tax Assessment Total Assessment is a certain percentage of the fair market value that is determined by local assessors to be the total taxable value of land and additions on the property. | Land | Improvement |
|---|---|---|---|---|
| 2025 | $4,030 | $276,000 | $120,000 | $156,000 |
| 2024 | $3,881 | $211,500 | $76,000 | $135,500 |
| 2023 | $3,881 | $211,500 | $76,000 | $135,500 |
| 2022 | $3,765 | $211,500 | $76,000 | $135,500 |
| 2021 | $3,210 | $130,700 | $33,600 | $97,100 |
| 2020 | $3,210 | $130,700 | $33,600 | $97,100 |
| 2019 | $3,210 | $130,700 | $33,600 | $97,100 |
| 2018 | $2,765 | $86,500 | $30,500 | $56,000 |
| 2017 | $2,765 | $86,500 | $30,500 | $56,000 |
| 2016 | $2,765 | $86,500 | $30,500 | $56,000 |
| 2015 | $2,549 | $77,000 | $30,500 | $46,500 |
| 2014 | $2,599 | $77,000 | $30,500 | $46,500 |
| 2013 | $2,599 | $77,000 | $30,500 | $46,500 |
Source: Public Records
Map
Nearby Homes
- 169 Byfield St
- 175 Byfield St
- 173 Byfield St
- 210 Pavilion Ave
- 214 Pavilion Ave
- 177 Byfield St
- 208 Pavilion Ave
- 179 Byfield St Unit 3
- 179 Byfield St
- 204 Pavilion Ave
- 181 Byfield St
- 200 Pavilion Ave
- 183 Byfield St
- 141 Byfield St
- 139 Byfield St
- 194 Pavilion Ave
- 211 Pavilion Ave
- 213 Pavilion Ave
- 213 Pavilion Ave Unit 3
- 213 Pavilion Ave Unit 2