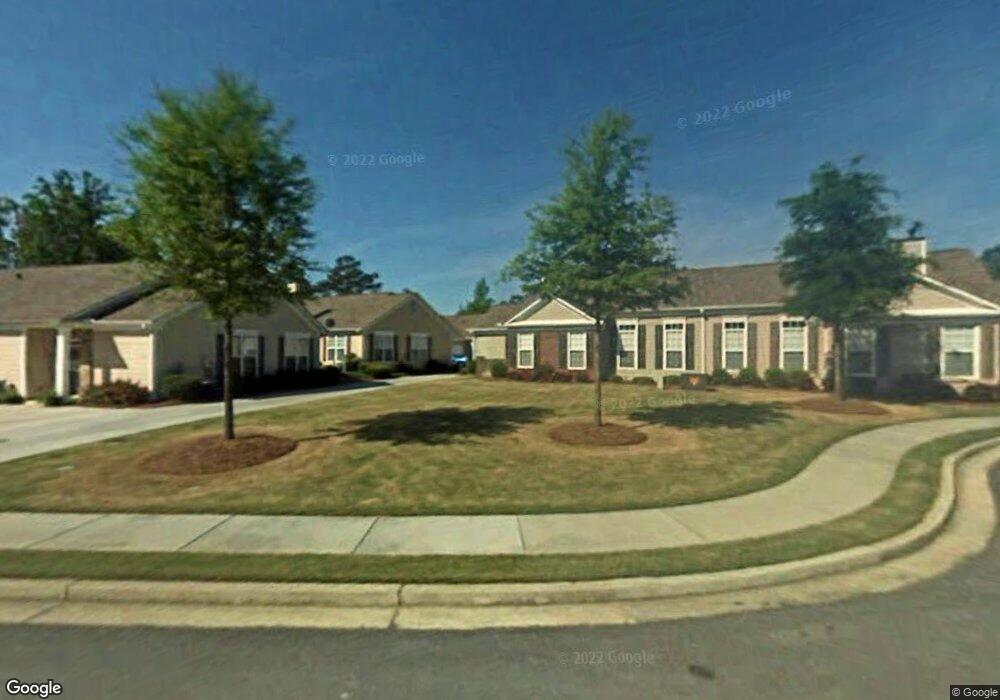
165 Camry Ln Grayson, GA 30017
Estimated Value: $274,000 - $283,000
2
Beds
2
Baths
1,314
Sq Ft
$212/Sq Ft
Est. Value
About This Home
This home is located at 165 Camry Ln, Grayson, GA 30017 and is currently estimated at $278,674, approximately $212 per square foot. 165 Camry Ln is a home located in Gwinnett County with nearby schools including Grayson Elementary School, Bay Creek Middle School, and Grayson High School.
Ownership History
Date
Name
Owned For
Owner Type
Purchase Details
Closed on
Dec 30, 2021
Sold by
Powers Faye R
Bought by
Mcelroy Heather C and Mcelroy Bobby A
Current Estimated Value
Purchase Details
Closed on
May 30, 2014
Sold by
Lee Mary Catherine
Bought by
Powers Faye R
Home Financials for this Owner
Home Financials are based on the most recent Mortgage that was taken out on this home.
Original Mortgage
$118,411
Interest Rate
4.75%
Mortgage Type
FHA
Purchase Details
Closed on
Jul 12, 2004
Sold by
Villas At Pebble Creek Farm Sale
Bought by
Lee Mary C and Lee Stephen
Home Financials for this Owner
Home Financials are based on the most recent Mortgage that was taken out on this home.
Original Mortgage
$128,320
Interest Rate
6.24%
Mortgage Type
Stand Alone Second
Purchase Details
Closed on
Oct 21, 2003
Sold by
Villas /Pebble Creek Farm Lls
Bought by
Villas /Pebble Creek Farms Sales
Home Financials for this Owner
Home Financials are based on the most recent Mortgage that was taken out on this home.
Original Mortgage
$921,900
Interest Rate
6.16%
Create a Home Valuation Report for This Property
The Home Valuation Report is an in-depth analysis detailing your home's value as well as a comparison with similar homes in the area
Home Values in the Area
Average Home Value in this Area
Purchase History
| Date | Buyer | Sale Price | Title Company |
|---|---|---|---|
| Mcelroy Heather C | $265,000 | -- | |
| Mcelroy Heather C | $265,000 | -- | |
| Powers Faye R | $122,500 | -- | |
| Lee Mary C | $160,400 | -- | |
| Villas /Pebble Creek Farms Sales | $346,400 | -- |
Source: Public Records
Mortgage History
| Date | Status | Borrower | Loan Amount |
|---|---|---|---|
| Previous Owner | Powers Faye R | $118,411 | |
| Previous Owner | Lee Mary C | $128,320 | |
| Previous Owner | Villas /Pebble Creek Farms Sales | $921,900 |
Source: Public Records
Tax History Compared to Growth
Tax History
| Year | Tax Paid | Tax Assessment Tax Assessment Total Assessment is a certain percentage of the fair market value that is determined by local assessors to be the total taxable value of land and additions on the property. | Land | Improvement |
|---|---|---|---|---|
| 2025 | $4,504 | $118,480 | $20,000 | $98,480 |
| 2024 | $4,238 | $109,600 | $20,000 | $89,600 |
| 2023 | $4,238 | $107,400 | $15,400 | $92,000 |
| 2022 | $3,598 | $92,600 | $12,800 | $79,800 |
| 2021 | $736 | $71,320 | $10,400 | $60,920 |
| 2020 | $734 | $71,320 | $10,400 | $60,920 |
| 2019 | $688 | $67,120 | $10,400 | $56,720 |
| 2018 | $669 | $56,840 | $12,000 | $44,840 |
| 2016 | $711 | $48,440 | $8,000 | $40,440 |
| 2015 | $726 | $45,400 | $8,000 | $37,400 |
| 2014 | -- | $42,520 | $8,000 | $34,520 |
Source: Public Records
Map
Nearby Homes
- 181 Camry Ln
- 314 Gable Brook Dr SW
- 958 Bramble Way
- 2687 Pointcrest Way
- 706 Hawthorn Ln Unit 3
- 1205 Pebble Bend Dr
- 2542 Haynes Meadow Ct
- 2629 Cooper Brook Dr
- 2639 Cooper Brook Dr
- 1028 Bramble Way
- 2810 Cooper Brook Dr
- 1135 Pebble Bend Dr
- 2880 Cooper Brook Dr
- 2797 Nathaniel Way
- 1335 Tullifenney Ct SW
- 3024 Gayle Manor Ln
- 2880 Creekwood Dr
- 2984 Gayle Manor Ln