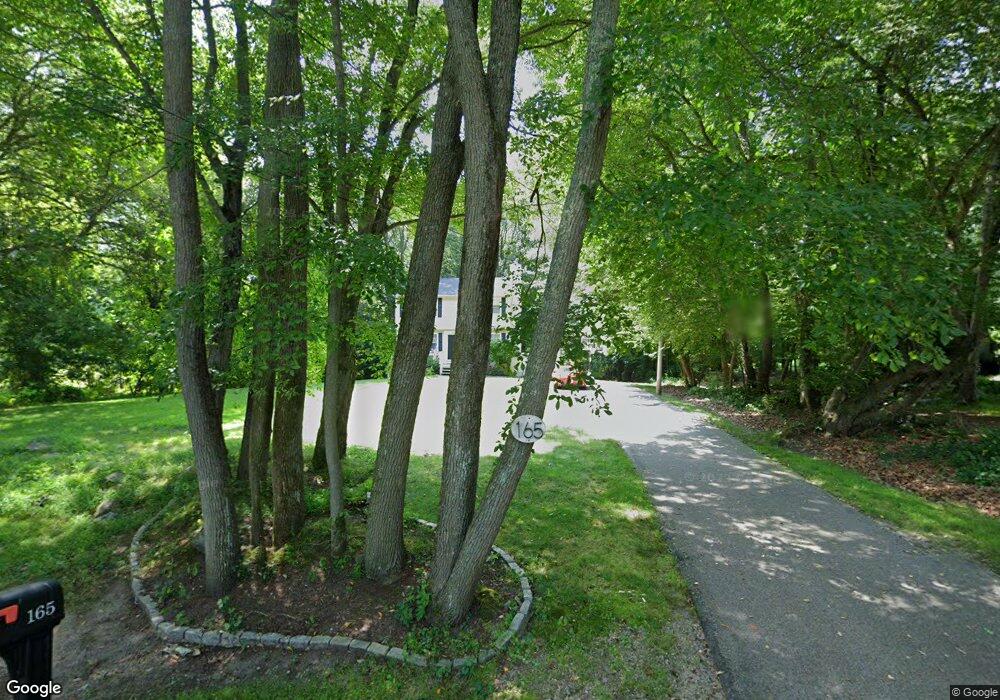
165 Capstan St Jamestown, RI 02835
West Reach Estates NeighborhoodEstimated Value: $870,515 - $924,000
3
Beds
3
Baths
2,127
Sq Ft
$424/Sq Ft
Est. Value
About This Home
This home is located at 165 Capstan St, Jamestown, RI 02835 and is currently estimated at $900,879, approximately $423 per square foot. 165 Capstan St is a home located in Newport County with nearby schools including Melrose Avenue School and Lawn Avenue School.
Ownership History
Date
Name
Owned For
Owner Type
Purchase Details
Closed on
Dec 22, 2011
Sold by
Parker-Westerfield Anne and Westerfield John R
Bought by
Trifero Ashley R and Trifero Sean J
Current Estimated Value
Home Financials for this Owner
Home Financials are based on the most recent Mortgage that was taken out on this home.
Original Mortgage
$268,800
Outstanding Balance
$218,585
Interest Rate
3.99%
Mortgage Type
Adjustable Rate Mortgage/ARM
Estimated Equity
$682,294
Purchase Details
Closed on
Dec 17, 2007
Sold by
Fletcher John T and Fletcher Susan B
Bought by
Westerfield John R and Parker-Westerfield Anne
Home Financials for this Owner
Home Financials are based on the most recent Mortgage that was taken out on this home.
Original Mortgage
$317,600
Interest Rate
6.3%
Mortgage Type
Purchase Money Mortgage
Purchase Details
Closed on
Jul 2, 1999
Sold by
Dierolf Christina
Bought by
Fletcher John T
Purchase Details
Closed on
Nov 9, 1995
Sold by
Waterford Homes Inc
Bought by
Dierolf Christina
Create a Home Valuation Report for This Property
The Home Valuation Report is an in-depth analysis detailing your home's value as well as a comparison with similar homes in the area
Home Values in the Area
Average Home Value in this Area
Purchase History
| Date | Buyer | Sale Price | Title Company |
|---|---|---|---|
| Trifero Ashley R | $336,000 | -- | |
| Westerfield John R | $397,000 | -- | |
| Fletcher John T | $170,000 | -- | |
| Dierolf Christina | $152,500 | -- |
Source: Public Records
Mortgage History
| Date | Status | Borrower | Loan Amount |
|---|---|---|---|
| Open | Dierolf Christina | $50,000 | |
| Open | Trifero Ashley R | $268,800 | |
| Previous Owner | Dierolf Christina | $317,600 |
Source: Public Records
Tax History Compared to Growth
Tax History
| Year | Tax Paid | Tax Assessment Tax Assessment Total Assessment is a certain percentage of the fair market value that is determined by local assessors to be the total taxable value of land and additions on the property. | Land | Improvement |
|---|---|---|---|---|
| 2025 | $4,088 | $724,800 | $269,400 | $455,400 |
| 2024 | $3,650 | $509,000 | $204,100 | $304,900 |
| 2023 | $3,627 | $519,600 | $204,100 | $315,500 |
| 2022 | $3,528 | $519,600 | $204,100 | $315,500 |
| 2021 | $3,229 | $390,000 | $197,900 | $192,100 |
| 2020 | $3,147 | $390,000 | $197,900 | $192,100 |
| 2019 | $3,140 | $390,000 | $197,900 | $192,100 |
| 2018 | $3,000 | $339,000 | $179,800 | $159,200 |
| 2017 | $2,936 | $339,000 | $179,800 | $159,200 |
| 2016 | $2,909 | $339,000 | $179,800 | $159,200 |
| 2015 | $3,133 | $356,800 | $210,200 | $146,600 |
| 2014 | $3,122 | $356,800 | $210,200 | $146,600 |
Source: Public Records
Map
Nearby Homes
- 398 Sampan Ave
- 280 W Reach Dr
- 86 Spanker St
- 58 Dolphin St
- 31 Stanchion St
- 10 Columbia Ln
- 174 Seaside Dr
- 18 Collins Terrace
- 625 N Main Rd
- 50 Prospect Ave
- 94 Spindrift St
- 121 Seaside Dr
- 12 Easterly Way
- 0 Circuit Ave
- 21 Helm St
- 27 Marcello Dr
- 10 Coulter St
- 10 Highland Rd
- 40 Web Ave Unit 221
- 73 Oceanwoods Dr
- 164 Capstan St
- 182 Capstan St
- 464 Beacon Ave
- 425 Capstan St
- 190 Capstan St
- 199 Capstan St
- 462 Gondola Ave
- 456 Beacon Ave
- 450 Beacon Ave
- 200 Capstan St
- 423 Gondola Ave
- 438 Beacon Ave
- 430 Gondola Ave
- 451 Beacon Ave
- 461 Schooner Ave
- 455 Schooner Ave
- 206 Capstan St
- 426 Beacon Ave
- 560 W Reach Dr
- 445 Schooner Ave