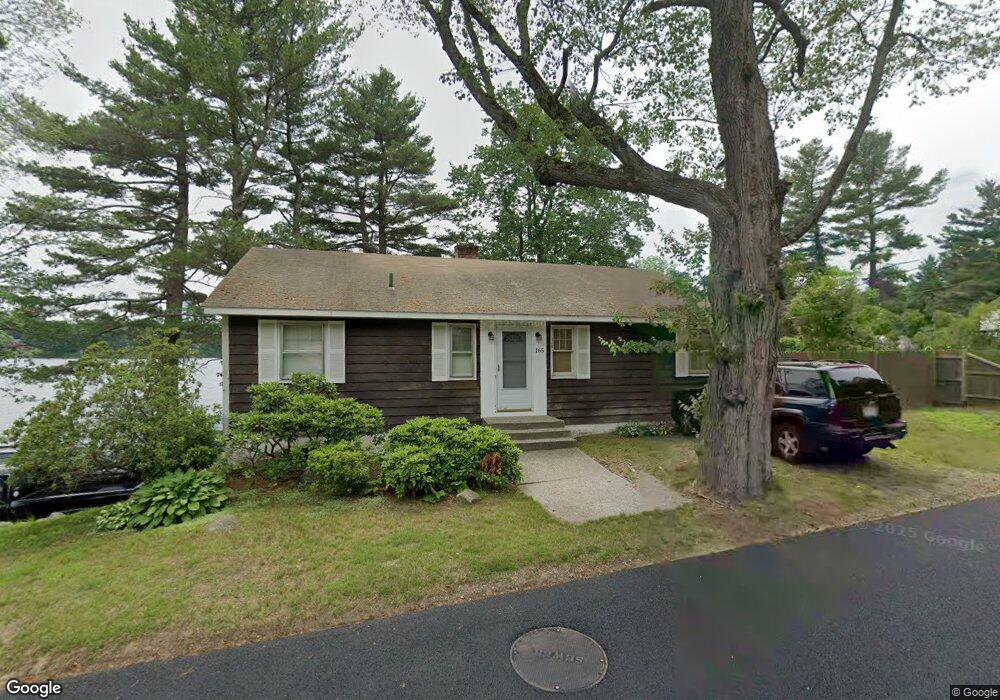
165 Chapel St Leicester, MA 01524
Estimated Value: $380,000 - $424,000
2
Beds
3
Baths
1,386
Sq Ft
$295/Sq Ft
Est. Value
About This Home
This home is located at 165 Chapel St, Leicester, MA 01524 and is currently estimated at $408,179, approximately $294 per square foot. 165 Chapel St is a home located in Worcester County with nearby schools including Leicester Integrated Preschool, Leicester Memorial Elementary School, and Leicester Middle School.
Ownership History
Date
Name
Owned For
Owner Type
Purchase Details
Closed on
May 17, 2001
Sold by
Homewood Christine A
Bought by
Miller Richard F and Miller Sandra L
Current Estimated Value
Home Financials for this Owner
Home Financials are based on the most recent Mortgage that was taken out on this home.
Original Mortgage
$76,500
Outstanding Balance
$28,565
Interest Rate
7.03%
Mortgage Type
Purchase Money Mortgage
Estimated Equity
$379,614
Create a Home Valuation Report for This Property
The Home Valuation Report is an in-depth analysis detailing your home's value as well as a comparison with similar homes in the area
Home Values in the Area
Average Home Value in this Area
Purchase History
| Date | Buyer | Sale Price | Title Company |
|---|---|---|---|
| Miller Richard F | $100,000 | -- | |
| Miller Richard F | $100,000 | -- |
Source: Public Records
Mortgage History
| Date | Status | Borrower | Loan Amount |
|---|---|---|---|
| Open | Miller Richard F | $40,000 | |
| Open | Miller Richard F | $76,500 | |
| Closed | Miller Richard F | $76,500 | |
| Previous Owner | Miller Richard F | $25,000 |
Source: Public Records
Tax History
| Year | Tax Paid | Tax Assessment Tax Assessment Total Assessment is a certain percentage of the fair market value that is determined by local assessors to be the total taxable value of land and additions on the property. | Land | Improvement |
|---|---|---|---|---|
| 2025 | $48 | $409,100 | $149,900 | $259,200 |
| 2024 | $4,610 | $367,300 | $136,000 | $231,300 |
| 2023 | $4,443 | $345,500 | $136,000 | $209,500 |
| 2022 | $4,363 | $311,900 | $129,700 | $182,200 |
| 2021 | $4,444 | $293,700 | $118,600 | $175,100 |
| 2020 | $3,793 | $254,400 | $111,500 | $142,900 |
| 2019 | $3,595 | $238,400 | $102,200 | $136,200 |
| 2018 | $3,636 | $226,000 | $102,200 | $123,800 |
| 2017 | $3,009 | $194,400 | $70,600 | $123,800 |
| 2016 | $2,821 | $189,300 | $76,200 | $113,100 |
| 2015 | $2,752 | $189,300 | $76,200 | $113,100 |
Source: Public Records
Map
Nearby Homes
- 14 Deer Pond Dr
- 46 Chapel St
- 963 Main St
- 9 Harding St
- 150 Paxton St
- 1A S Main St
- 0 S Main St Unit 73392435
- 92-94 Sargent St
- 12 Holcomb St
- 15 Breezy Green Rd
- 168 Apricot St
- 1560 Main St
- 1511 Main St Unit CPH9
- 55 Parsons Hill Dr
- 00 Pleasant St
- 42 3rd St
- 18 Sherer Trail
- 155 Rawson St
- 29 Outlook Dr
- 19 Healy Rd
Your Personal Tour Guide
Ask me questions while you tour the home.