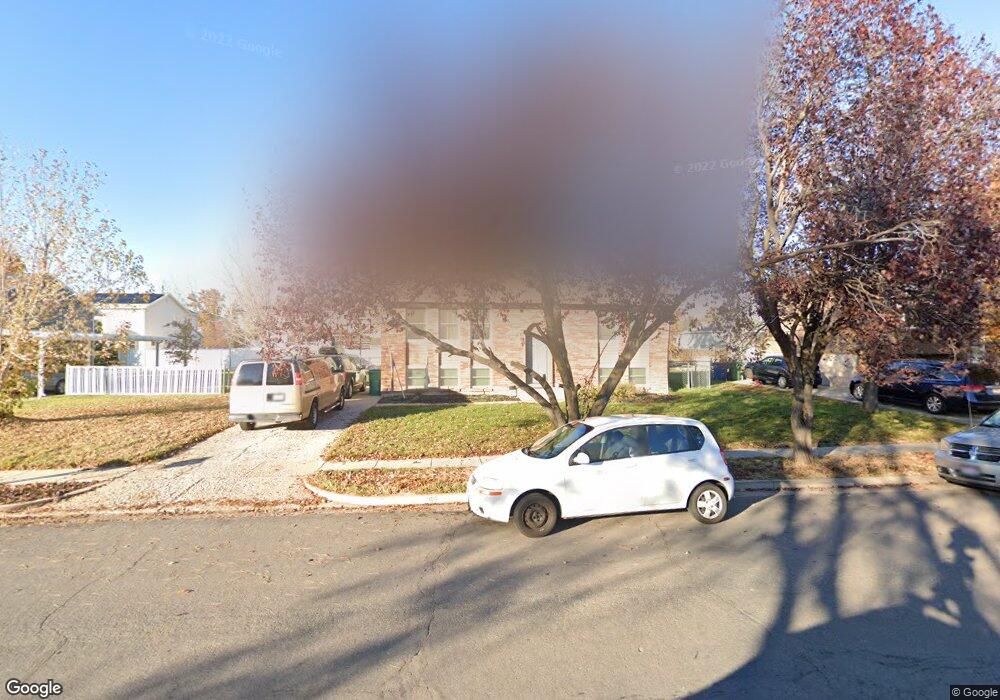
165 E 1250 N Layton, UT 84041
Estimated Value: $410,000 - $445,000
4
Beds
2
Baths
1,960
Sq Ft
$219/Sq Ft
Est. Value
About This Home
This home is located at 165 E 1250 N, Layton, UT 84041 and is currently estimated at $428,853, approximately $218 per square foot. 165 E 1250 N is a home located in Davis County with nearby schools including King Elementary School, Central Davis Junior High School, and Northridge High School.
Ownership History
Date
Name
Owned For
Owner Type
Purchase Details
Closed on
Feb 28, 2008
Sold by
Franc Mark W and Franc Julie E
Bought by
Simpson Daniel Henry and Simpson Alisa
Current Estimated Value
Home Financials for this Owner
Home Financials are based on the most recent Mortgage that was taken out on this home.
Original Mortgage
$157,091
Outstanding Balance
$95,533
Interest Rate
5.64%
Mortgage Type
Purchase Money Mortgage
Estimated Equity
$333,320
Create a Home Valuation Report for This Property
The Home Valuation Report is an in-depth analysis detailing your home's value as well as a comparison with similar homes in the area
Home Values in the Area
Average Home Value in this Area
Purchase History
| Date | Buyer | Sale Price | Title Company |
|---|---|---|---|
| Simpson Daniel Henry | -- | Security Title |
Source: Public Records
Mortgage History
| Date | Status | Borrower | Loan Amount |
|---|---|---|---|
| Open | Simpson Daniel Henry | $157,091 |
Source: Public Records
Tax History
| Year | Tax Paid | Tax Assessment Tax Assessment Total Assessment is a certain percentage of the fair market value that is determined by local assessors to be the total taxable value of land and additions on the property. | Land | Improvement |
|---|---|---|---|---|
| 2025 | $1,918 | $201,300 | $99,118 | $102,182 |
| 2024 | $1,867 | $197,450 | $115,664 | $81,786 |
| 2023 | $1,856 | $346,000 | $139,109 | $206,891 |
| 2022 | $1,880 | $190,300 | $73,071 | $117,229 |
| 2021 | $1,752 | $266,000 | $101,243 | $164,757 |
| 2020 | $1,588 | $230,000 | $85,715 | $144,285 |
| 2019 | $1,579 | $224,000 | $81,892 | $142,108 |
| 2018 | $1,426 | $203,000 | $81,892 | $121,108 |
| 2016 | $1,223 | $89,815 | $25,821 | $63,994 |
| 2015 | $1,128 | $78,650 | $25,821 | $52,829 |
| 2014 | $1,098 | $78,273 | $25,821 | $52,452 |
| 2013 | -- | $78,054 | $18,612 | $59,442 |
Source: Public Records
Map
Nearby Homes
Your Personal Tour Guide
Ask me questions while you tour the home.