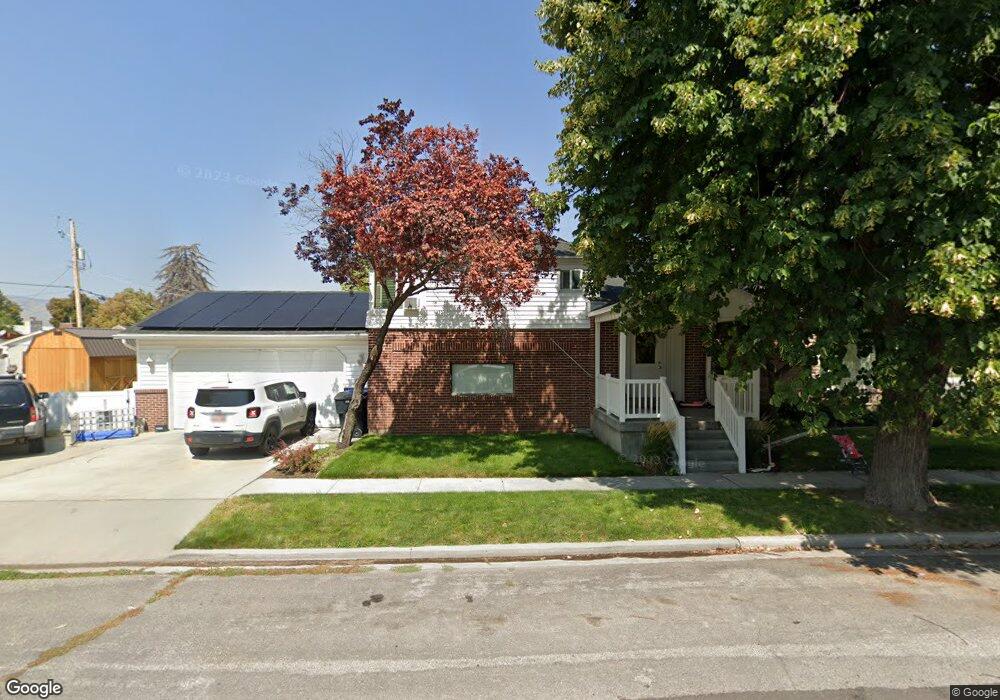
165 E 500 N Tremonton, UT 84337
Estimated Value: $398,145 - $462,000
4
Beds
2
Baths
2,800
Sq Ft
$156/Sq Ft
Est. Value
About This Home
This home is located at 165 E 500 N, Tremonton, UT 84337 and is currently estimated at $437,536, approximately $156 per square foot. 165 E 500 N is a home located in Box Elder County with nearby schools including North Park School, Bear River Middle School, and Alice C. Harris Intermediate School.
Ownership History
Date
Name
Owned For
Owner Type
Purchase Details
Closed on
Jan 31, 2020
Sold by
Ballard Bradley K
Bought by
Ballard Bradley K and Cook Erin R
Current Estimated Value
Home Financials for this Owner
Home Financials are based on the most recent Mortgage that was taken out on this home.
Original Mortgage
$276,767
Outstanding Balance
$245,005
Interest Rate
3.7%
Mortgage Type
New Conventional
Estimated Equity
$192,531
Purchase Details
Closed on
Dec 26, 2019
Sold by
Scoffield Darrin G and Scoffield Jennifer
Bought by
Ballard Bradley K
Home Financials for this Owner
Home Financials are based on the most recent Mortgage that was taken out on this home.
Original Mortgage
$276,767
Outstanding Balance
$245,005
Interest Rate
3.7%
Mortgage Type
New Conventional
Estimated Equity
$192,531
Purchase Details
Closed on
Jun 14, 2013
Sold by
Scoffield Darrin G and Scoffield Jenifer Kay
Bought by
Scoffield Darrin G and Scoffield Jenifer Kay
Create a Home Valuation Report for This Property
The Home Valuation Report is an in-depth analysis detailing your home's value as well as a comparison with similar homes in the area
Home Values in the Area
Average Home Value in this Area
Purchase History
| Date | Buyer | Sale Price | Title Company |
|---|---|---|---|
| Ballard Bradley K | -- | American Secure Ttl Brigham | |
| Ballard Bradley K | -- | American Secure Ttl Tremonto | |
| Scoffield Darrin G | -- | None Available |
Source: Public Records
Mortgage History
| Date | Status | Borrower | Loan Amount |
|---|---|---|---|
| Open | Ballard Bradley K | $276,767 |
Source: Public Records
Tax History
| Year | Tax Paid | Tax Assessment Tax Assessment Total Assessment is a certain percentage of the fair market value that is determined by local assessors to be the total taxable value of land and additions on the property. | Land | Improvement |
|---|---|---|---|---|
| 2025 | $2,635 | $409,964 | $105,000 | $304,964 |
| 2024 | $2,418 | $418,665 | $105,000 | $313,665 |
| 2023 | $2,554 | $434,190 | $100,000 | $334,190 |
| 2022 | $2,115 | $205,086 | $16,500 | $188,586 |
| 2021 | $1,978 | $248,067 | $30,000 | $218,067 |
| 2020 | $1,610 | $248,067 | $30,000 | $218,067 |
| 2019 | $1,493 | $122,639 | $16,500 | $106,139 |
| 2018 | $1,593 | $119,535 | $13,750 | $105,785 |
| 2017 | $1,646 | $217,336 | $13,750 | $192,336 |
| 2016 | $1,614 | $114,497 | $13,750 | $100,747 |
| 2015 | $1,454 | $105,339 | $13,750 | $91,589 |
| 2014 | $1,454 | $100,977 | $13,750 | $87,227 |
| 2013 | -- | $100,565 | $13,338 | $87,227 |
Source: Public Records
Map
Nearby Homes
Your Personal Tour Guide
Ask me questions while you tour the home.