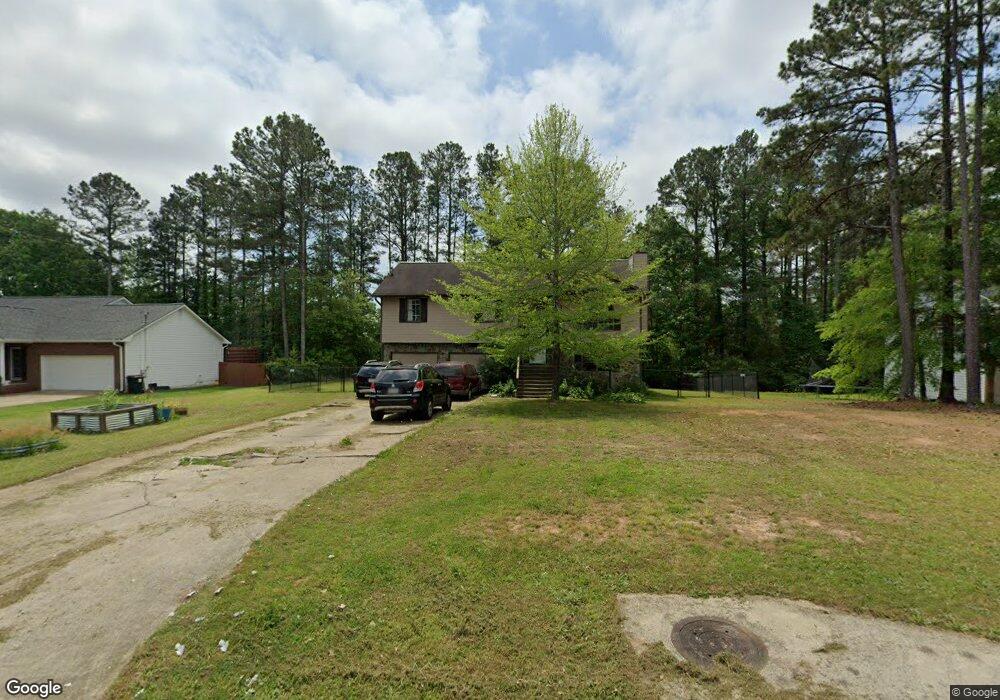
165 Eagles Nest Cir Carrollton, GA 30116
Estimated Value: $278,000 - $298,809
4
Beds
3
Baths
2,018
Sq Ft
$142/Sq Ft
Est. Value
About This Home
This home is located at 165 Eagles Nest Cir, Carrollton, GA 30116 and is currently estimated at $286,202, approximately $141 per square foot. 165 Eagles Nest Cir is a home located in Carroll County with nearby schools including Central Elementary School, Central Middle School, and Central High School.
Ownership History
Date
Name
Owned For
Owner Type
Purchase Details
Closed on
Oct 19, 2016
Sold by
Smith Shari Lin
Bought by
Krebs Adam Frank
Current Estimated Value
Home Financials for this Owner
Home Financials are based on the most recent Mortgage that was taken out on this home.
Original Mortgage
$132,456
Outstanding Balance
$106,323
Interest Rate
3.5%
Mortgage Type
FHA
Estimated Equity
$179,879
Purchase Details
Closed on
Nov 15, 2001
Sold by
Case Patsy S
Bought by
Smith Shari Lin
Purchase Details
Closed on
Jun 22, 2001
Sold by
Case Patsy S
Bought by
Smith Shari Lin
Purchase Details
Closed on
Oct 16, 2000
Sold by
Case Wallace
Bought by
Case Patsy S
Purchase Details
Closed on
Oct 6, 1999
Sold by
Mcdowell Jimmy G
Bought by
Case Wallace
Purchase Details
Closed on
Mar 24, 1999
Sold by
Mcdowell Dennis H
Bought by
Mcdowell Jimmy G
Purchase Details
Closed on
Mar 20, 1998
Bought by
Mcdowell Dennis H
Create a Home Valuation Report for This Property
The Home Valuation Report is an in-depth analysis detailing your home's value as well as a comparison with similar homes in the area
Home Values in the Area
Average Home Value in this Area
Purchase History
| Date | Buyer | Sale Price | Title Company |
|---|---|---|---|
| Krebs Adam Frank | $134,900 | -- | |
| Smith Shari Lin | -- | -- | |
| Smith Shari Lin | $112,900 | -- | |
| Case Patsy S | -- | -- | |
| Case Wallace | $109,900 | -- | |
| Mcdowell Jimmy G | $13,800 | -- | |
| Mcdowell Dennis H | -- | -- |
Source: Public Records
Mortgage History
| Date | Status | Borrower | Loan Amount |
|---|---|---|---|
| Open | Krebs Adam Frank | $132,456 |
Source: Public Records
Tax History Compared to Growth
Tax History
| Year | Tax Paid | Tax Assessment Tax Assessment Total Assessment is a certain percentage of the fair market value that is determined by local assessors to be the total taxable value of land and additions on the property. | Land | Improvement |
|---|---|---|---|---|
| 2024 | $2,637 | $116,554 | $7,400 | $109,154 |
| 2023 | $2,637 | $106,618 | $7,400 | $99,218 |
| 2022 | $2,150 | $85,733 | $6,000 | $79,733 |
| 2021 | $1,904 | $74,252 | $6,000 | $68,252 |
| 2020 | $1,518 | $59,130 | $6,000 | $53,130 |
| 2019 | $1,429 | $55,211 | $6,000 | $49,211 |
| 2018 | $1,232 | $46,932 | $4,000 | $42,932 |
| 2017 | $1,236 | $46,932 | $4,000 | $42,932 |
| 2016 | $1,076 | $46,932 | $4,000 | $42,932 |
| 2015 | $1,016 | $40,330 | $4,000 | $36,330 |
| 2014 | $811 | $32,878 | $4,000 | $28,878 |
Source: Public Records
Map
Nearby Homes
- 145 Eagles Nest Cir
- 185 Eagles Nest Cir
- 1352 Horsley Mill Rd
- 1362 Horsley Mill Rd
- 205 Eagles Nest Cir
- 1342 Horsley Mill Rd
- 125 Eagles Nest Cir
- 148 Eagles Nest Cir
- 166 Eagles Nest Cir
- 136 Eagles Nest Cir
- 1372 Horsley Mill Rd
- 1332 Horsley Mill Rd
- 184 Eagles Nest Cir
- 124 Eagles Nest Cir Unit 94
- 124 Eagles Nest Cir
- 105 Eagles Nest Cir
- 1382 Horsley Mill Rd
- 232 Eagles Nest Cir
- 1322 Horsley Mill Rd
- 112 Eagles Nest Cir