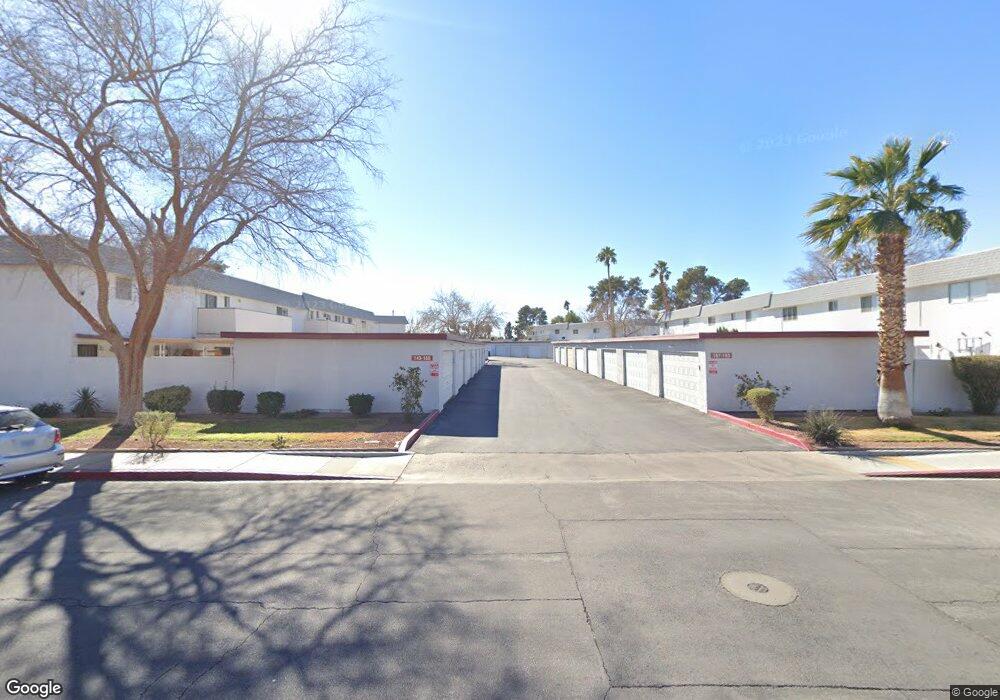
165 Greenbriar Townhouse Way Unit 1 Las Vegas, NV 89121
Estimated Value: $168,248 - $257,000
1
Bed
1
Bath
660
Sq Ft
$305/Sq Ft
Est. Value
About This Home
This home is located at 165 Greenbriar Townhouse Way Unit 1, Las Vegas, NV 89121 and is currently estimated at $201,062, approximately $304 per square foot. 165 Greenbriar Townhouse Way Unit 1 is a home located in Clark County with nearby schools including Will Beckley Elementary School, Jerome Mack Middle School, and Chaparral High School.
Ownership History
Date
Name
Owned For
Owner Type
Purchase Details
Closed on
Oct 20, 2006
Sold by
Burgess Bryan
Bought by
Lucik Annetta L
Current Estimated Value
Home Financials for this Owner
Home Financials are based on the most recent Mortgage that was taken out on this home.
Original Mortgage
$87,960
Outstanding Balance
$52,197
Interest Rate
6.36%
Mortgage Type
Balloon
Estimated Equity
$148,865
Purchase Details
Closed on
Jun 17, 2004
Sold by
Lefler Sandra
Bought by
Burgess Bryan A
Home Financials for this Owner
Home Financials are based on the most recent Mortgage that was taken out on this home.
Original Mortgage
$58,400
Interest Rate
6.31%
Mortgage Type
Unknown
Purchase Details
Closed on
May 27, 2004
Sold by
Collins Judy
Bought by
Burgess Bryan
Home Financials for this Owner
Home Financials are based on the most recent Mortgage that was taken out on this home.
Original Mortgage
$58,400
Interest Rate
6.31%
Mortgage Type
Unknown
Create a Home Valuation Report for This Property
The Home Valuation Report is an in-depth analysis detailing your home's value as well as a comparison with similar homes in the area
Home Values in the Area
Average Home Value in this Area
Purchase History
| Date | Buyer | Sale Price | Title Company |
|---|---|---|---|
| Lucik Annetta L | $109,950 | Nevada Title Company | |
| Burgess Bryan A | -- | Equity Title Of Nevada | |
| Burgess Bryan | $73,000 | Equity Title Of Nevada |
Source: Public Records
Mortgage History
| Date | Status | Borrower | Loan Amount |
|---|---|---|---|
| Open | Lucik Annetta L | $87,960 | |
| Previous Owner | Burgess Bryan | $58,400 | |
| Closed | Burgess Bryan | $14,600 |
Source: Public Records
Tax History Compared to Growth
Tax History
| Year | Tax Paid | Tax Assessment Tax Assessment Total Assessment is a certain percentage of the fair market value that is determined by local assessors to be the total taxable value of land and additions on the property. | Land | Improvement |
|---|---|---|---|---|
| 2025 | $500 | $30,932 | $18,550 | $12,382 |
| 2024 | $464 | $30,932 | $18,550 | $12,382 |
| 2023 | $464 | $30,112 | $19,250 | $10,862 |
| 2022 | $430 | $26,807 | $16,800 | $10,007 |
| 2021 | $398 | $24,621 | $16,100 | $8,521 |
| 2020 | $367 | $23,004 | $14,350 | $8,654 |
| 2019 | $344 | $20,630 | $12,250 | $8,380 |
| 2018 | $328 | $18,190 | $9,800 | $8,390 |
| 2017 | $462 | $15,249 | $7,000 | $8,249 |
| 2016 | $309 | $13,425 | $4,550 | $8,875 |
| 2015 | $307 | $13,091 | $4,550 | $8,541 |
| 2014 | $298 | $9,880 | $3,500 | $6,380 |
Source: Public Records
Map
Nearby Homes
- 163 Greenbriar Townhouse Way
- 139 Greenbriar Townhouse Way
- 171 Greenbriar Townhouse Way
- 225 Greenbriar Townhouse Way
- 146 Greenbriar Townhouse Way
- 747 Greenbriar Townhouse Way
- 150 Greenbriar Townhouse Way
- 130 Greenbriar Townhouse Way
- 335 Greenbriar Townhouse Way
- 3247 Greenbriar Dr
- 3085 Greenbriar Dr
- 565 Greenbriar Townhouse Way
- 3366 Sylvia St
- 3169 Nottingham Dr
- 3386 El Camino Real
- 3412 Townhouse Dr
- 275 Pecos Way
- 3558 Wayne Cir
- 2945 Torreon Ln
- 431 Las Casitas Way
- 161 Greenbriar Townhouse Way
- 159 Greenbriar Townhouse Way
- 157 Greenbriar Townhouse Way
- 193 Greenbriar Townhouse Way
- 3776 Millwood Ave
- 191 Greenbriar Townhouse Way
- 189 Greenbriar Townhouse Way
- 187 Greenbriar Townhouse Way
- 155 Greenbriar Townhouse Way
- 3786 Millwood Ave
- 185 Greenbriar Townhouse Way
- 153 Greenbriar Townhouse Way
- 183 Greenbriar Townhouse Way
- 3756 Millwood Ave
- 141 Greenbriar Townhouse Way
- 151 Greenbriar Townhouse Way
- 181 Greenbriar Townhouse Way Unit 1
- 137 Greenbriar Townhouse Way
- 179 Greenbriar Townhouse Way
- 3796 Millwood Ave